Analyzing Wednesday's Trades:
EUR/USD on 1H Chart
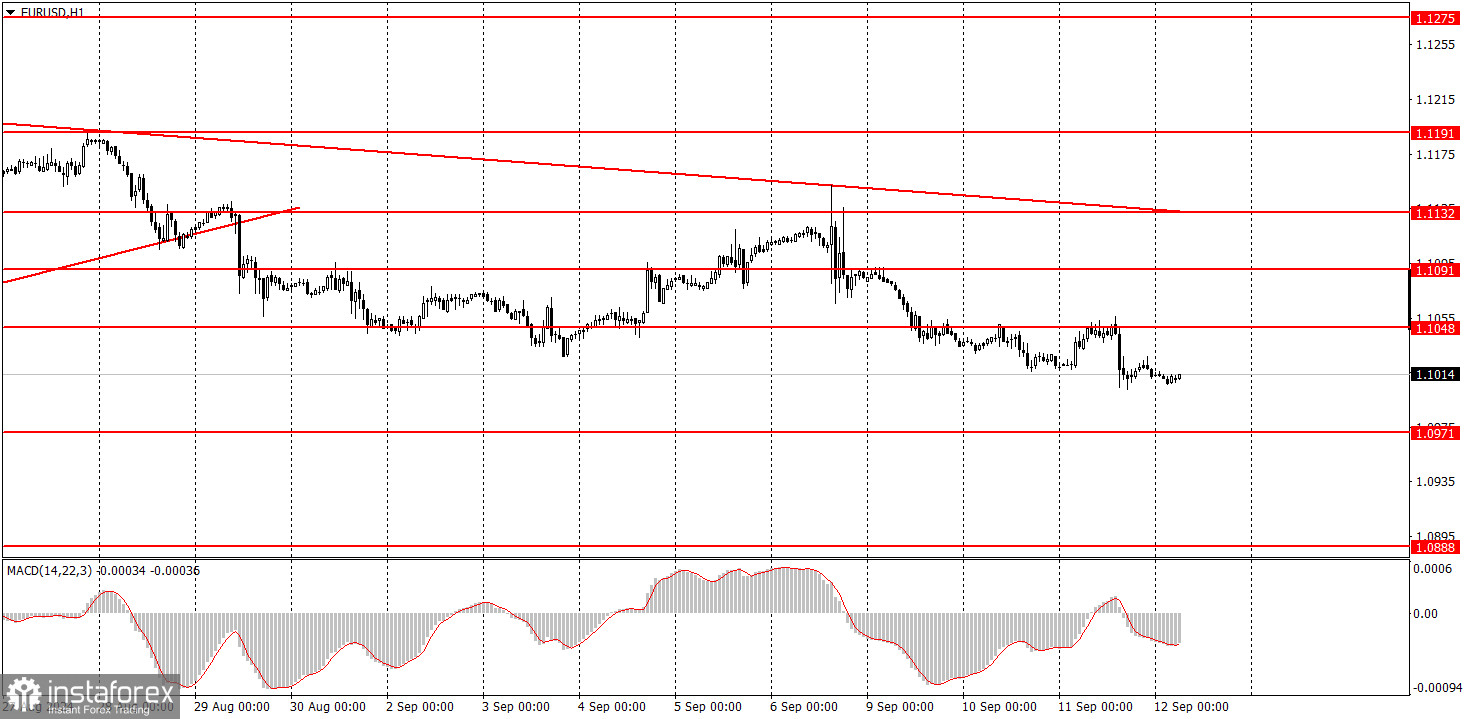
The EUR/USD pair sustained its downward movement on Wednesday. As a reminder, the "report of the week" — the U.S. Consumer Price Index for August — was released yesterday. U.S. inflation has slowed to 2.5%, significantly increasing the likelihood of a more aggressive Federal Reserve rate cut. In the past, such information would have provoked the collapse of the U.S. dollar, but not this time. The dollar, although not by much, strengthened yesterday. From our perspective, this is a positive sign for the U.S. currency, which has been falling throughout 2024. We have repeatedly warned that the dollar is overly oversold and unreasonably cheap and that the market uses almost any factor to sell it, which is illogical. Perhaps the time has come to restore the fair rate. The downward trend is still fragile but does exist; it persists, and the dollar is slowly but surely rising.
EUR/USD on 5M Chart
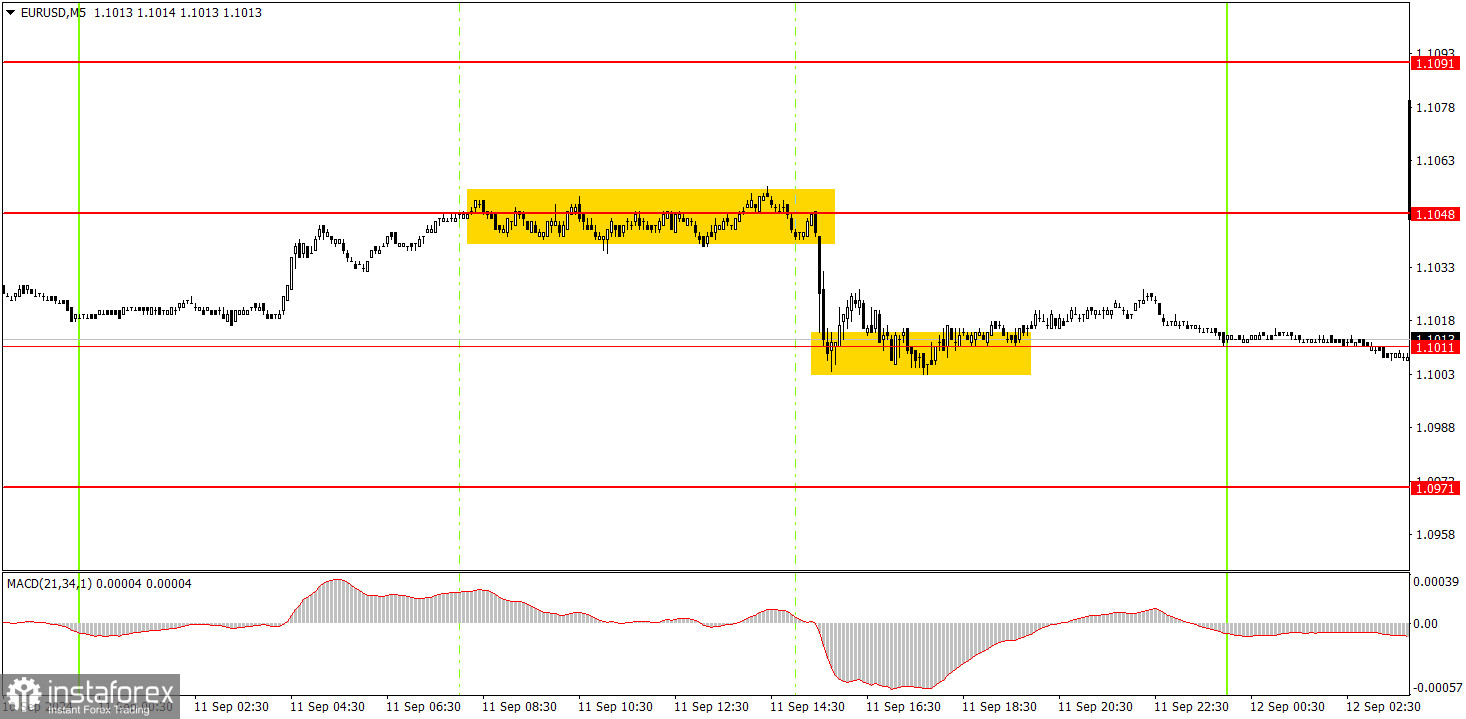
Two trading signals were generated in the 5-minute time frame on Wednesday. Initially, the price traded flat along the 1.1048 level throughout the European session. Then, the U.S. inflation report was released, and in 15 minutes, the price dropped from 1.1048 to 1.1011. As we can see, volatility was still very weak. However, novice traders likely would not have managed to capitalize on this signal, as the lower inflation figure logically should have caused the pair to rise, not fall.
How to Trade on Thursday:
In the hourly time frame, the EUR/USD pair has consolidated below the ascending trend line and, for the first time in a long while, has a chance to form a downward trend that would be logical and consistent with all factors and types of analysis. Unfortunately, illogical dollar sales could quickly resume, as no one knows how long the market will continue to price in the Fed's monetary policy easing, which has yet to start. The market continues to price in all future rate cuts by the Fed into the dollar's value, and U.S. macroeconomic data often disappoint rather than please. Nevertheless, the dollar is taking its first tentative steps toward "its" trend.
If the price consolidates below the 1.1011 level on Thursday, novice traders might expect a new decline in the pair.
The key levels to consider on the 5M time frame are 1.0726-1.0733, 1.0797-1.0804, 1.0838-1.0856, 1.0888-1.0896, 1.0940, 1.0971, 1.1011, 1.1048, 1.1091, 1.1132, 1.1191, and 1.1275-1.1292. For Thursday, the Eurozone has the European Central Bank meeting and Christine Lagarde's speech scheduled, while in the U.S., there will be the Producer Price Index and unemployment claims. Of course, all market attention will be focused on Lagarde's speech.
Basic Rules of the Trading System:
1) The strength of a signal is determined by the time it takes for the signal to form (bounce or level breakthrough). The less time it took, the stronger the signal.
2) If two or more trades were opened around any level due to false signals, subsequent signals from that level should be ignored.
3) In a flat market, any currency pair can form multiple false signals or none at all. In any case, it's better to stop trading at the first signs of a flat market.
4) Trades should be opened between the start of the European session and midway through the U.S. session. After this period, all trades must be closed manually.
5) In the hourly time frame, trades based on MACD signals are only advisable amidst good volatility and a trend confirmed by a trendline or trend channel.
6) If two levels are too close to each other (5 to 20 pips), they should be considered a support or resistance area.
7) After moving 15 pips in the intended direction, the Stop Loss should be set to break even.
What's on the Charts:
Support and Resistance price levels: targets for opening long or short positions. You can place Take Profit levels around them.
Red lines: channels or trend lines that depict the current trend and indicate the preferred trading direction.
The MACD indicator (14,22,3): encompassing both the histogram and signal line, acts as an auxiliary tool and can also be used as a source of signals.
Important speeches and reports (always noted in the news calendar) can profoundly influence the movement of a currency pair. Hence, trading during their release calls for heightened caution. It may be reasonable to exit the market to avoid sharp price reversals against the prevailing movement.
For beginners, it's important to remember that not every trade will yield profit. Developing a clear strategy and effective money management is key to success in trading over the long term.