Analyzing Friday's Trades:
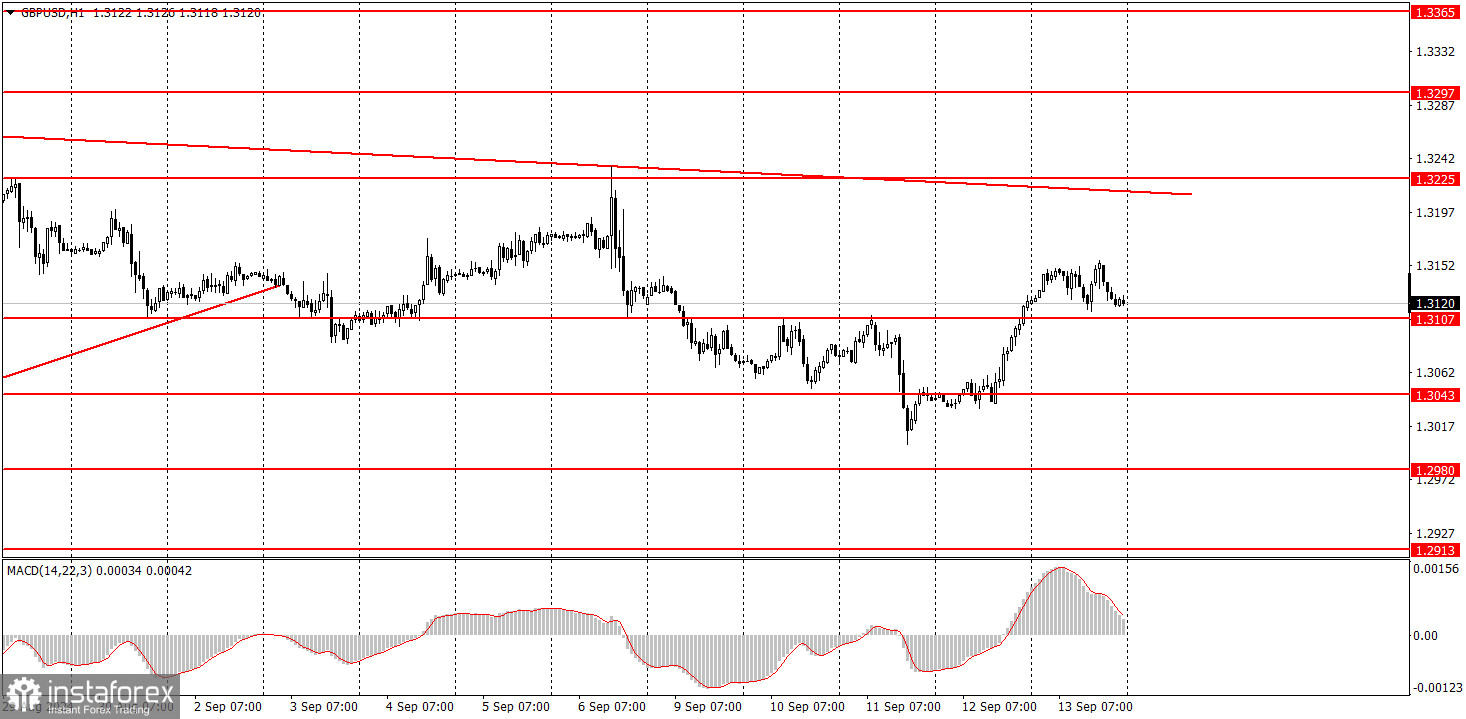
GBP/USD on 1H Chart
The GBP/USD pair also traded in a low-volatility flat on Friday. There was very little macroeconomic data. We can only highlight the University of Michigan Consumer Sentiment Index in the U.S., which came in slightly stronger than expected. However, this report did not bring big dividends to the dollar. Meanwhile, the British pound rose on Thursday when even less important data were released. The market decided that the dovish European Central Bank meeting was a reason to buy the euro and the pound. All the pair's movements continue to be based on market expectations regarding the Federal Reserve's rates. Neither macroeconomic data nor fundamental events seem to influence these expectations.
As with the euro, the dollar still has decent prospects below the trendline, but the recent downward movement has been so uncertain that it is difficult to view it as the start of a long-term downtrend.
GBP/USD on 5M Chart
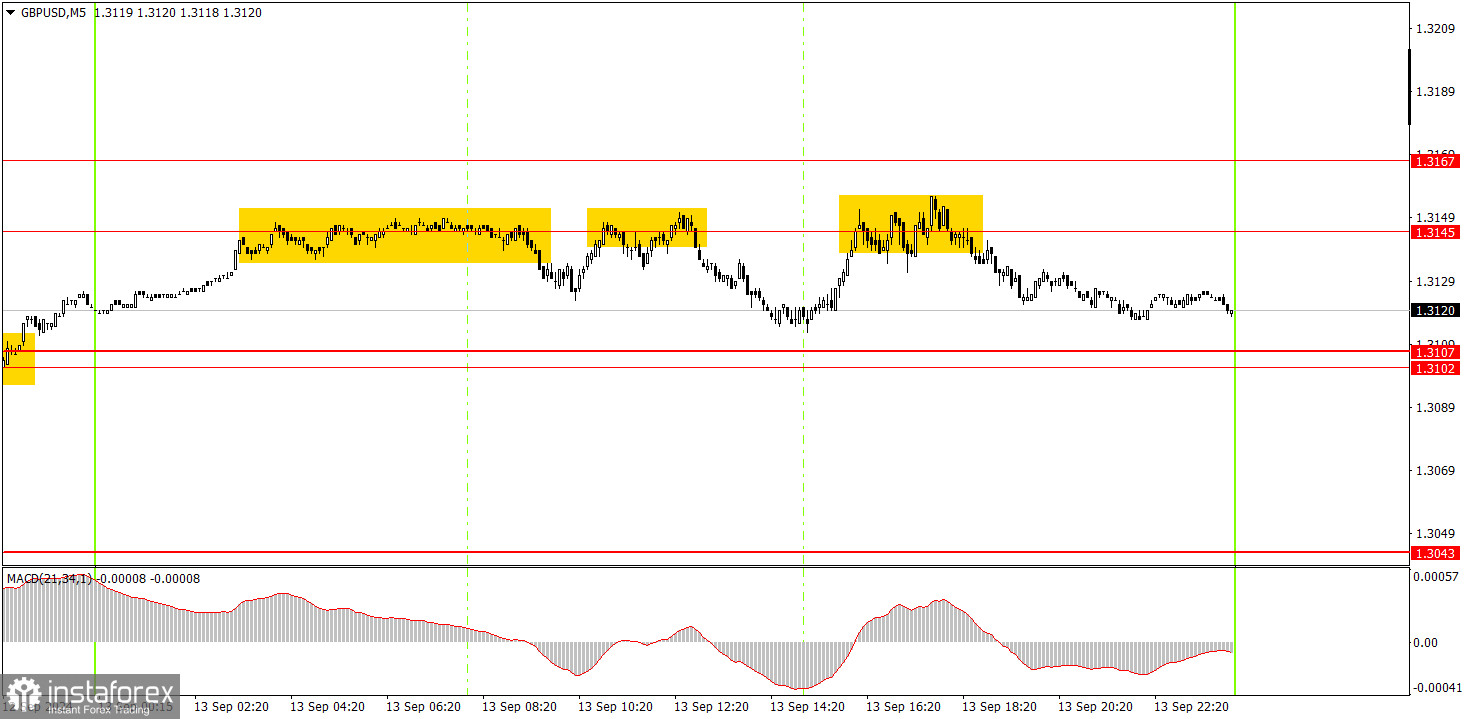
In the 5-minute time frame on Friday, the price bounced three times from the 1.3145 level, which should be considered in conjunction with the 1.3167 level. The price failed to reach the nearest target in all three cases, located 38 pips lower. The day's volatility was just 43 pips. There was no desire to trade among market participants on Friday. Novice traders could have opened short positions based on the sell signals, and although these trades would not have resulted in losses, it was also challenging to make money on them.
How to Trade on Monday:
In the hourly time frame, GBP/USD has a good chance of resuming the global downtrend or at least seeing a significant correction. The British pound remains overbought, the dollar is undervalued, and the market is still much more inclined to sell the dollar than to buy it. So far, the pound only shows a weak bearish correction. It is too early to speak of a full-fledged downtrend. The much-anticipated Fed meeting will take place this week, and after that, conclusions can be made regarding the medium-term direction of the dollar's movement.
On Monday, the pair might resume declining, as it rose on Thursday almost without apparent reason. However, the market again shows that it is willing to buy the pound without any justification.
In the 5-minute time frame, you can currently trade around the levels of 1.2605-1.2633, 1.2684-1.2693, 1.2748, 1.2791-1.2798, 1.2848-1.2860, 1.2913, 1.2980-1.2993, 1.3043, 1.3102-1.3107, 1.3145-1.3167, 1.3225, 1.3272, 1.3310. On Monday, no significant events or reports are scheduled in the UK or the U.S., so there is a high likelihood of another flat movement and low volatility.
Basic Rules of the Trading System:
1) The strength of a signal is determined by the time it takes for the signal to form (bounce or level breakthrough). The less time it took, the stronger the signal.
2) If two or more trades were opened around any level due to false signals, subsequent signals from that level should be ignored.
3) In a flat market, any currency pair can form multiple false signals or none at all. In any case, it's better to stop trading at the first signs of a flat market.
4) Trades should be opened between the start of the European session and midway through the U.S. session. After this period, all trades must be closed manually.
5) In the hourly time frame, trades based on MACD signals are only advisable amidst good volatility and a trend confirmed by a trendline or trend channel.
6) If two levels are too close to each other (5 to 20 pips), they should be considered a support or resistance area.
7) After moving 20 pips in the intended direction, the Stop Loss should be set to break even.
What's on the Charts:
Support and Resistance price levels: targets for opening long or short positions. You can place Take Profit levels around them.
Red lines: channels or trend lines that depict the current trend and indicate the preferred trading direction.
The MACD indicator (14,22,3): encompassing both the histogram and signal line, acts as an auxiliary tool and can also be used as a source of signals.
Important speeches and reports (always noted in the news calendar) can profoundly influence the movement of a currency pair. Hence, trading during their release calls for heightened caution. It may be reasonable to exit the market to avoid sharp price reversals against the prevailing movement.
For beginners, it's important to remember that not every trade will yield profit. Developing a clear strategy and effective money management is key to success in trading over the long term.