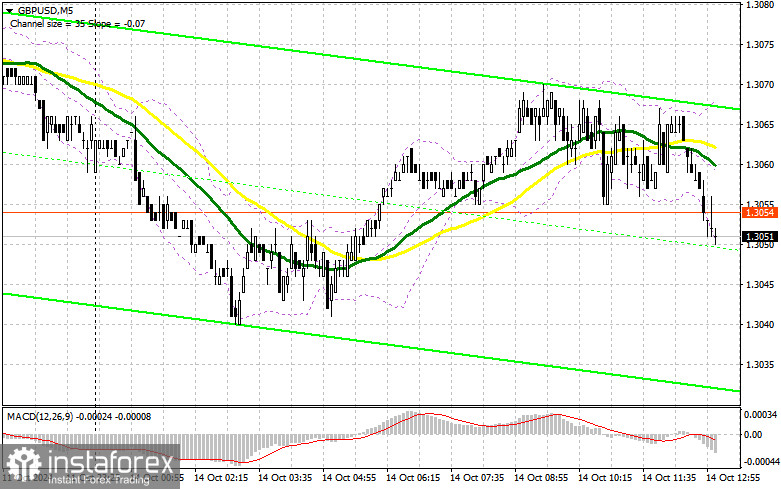
In my morning forecast, I focused on the 1.3086 level and planned to base my market entry decisions on it. Let's look at the 5-minute chart and analyze what happened. There was a rise, but it was too small for the pair to reach the 1.3086 level. The low market volatility has forced me to adjust the technical picture for the second half of the day.
For Opening Long Positions on GBP/USD:
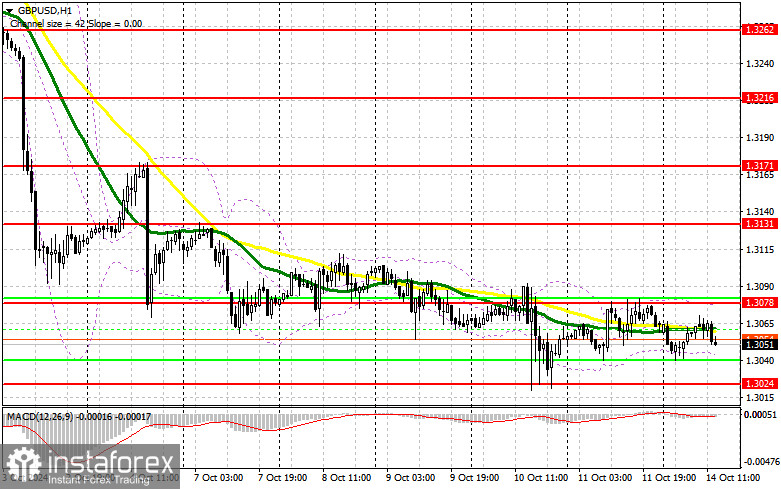
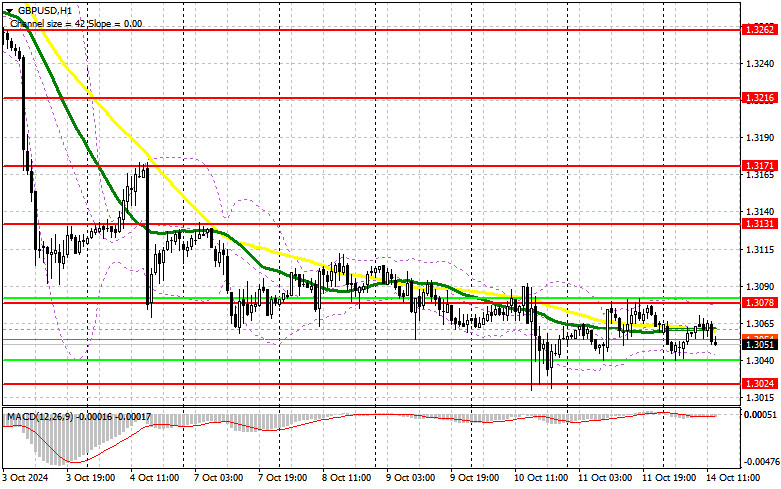
The speeches of several FOMC members are the only events expected during the U.S. session, so I don't anticipate significant movement in the pair and will stick to the strategy of trading within the sideways channel. If the pound declines, a false breakout at the 1.3024 level (weekly low) could offer a chance for a recovery toward the 1.3078 resistance, formed during the first half of the day. A breakout and retest of this range from top to bottom would increase the chances of an upward trend early in the week. This would hit sellers' stop orders and provide a solid entry point for long positions with a target of 1.3131. The final target would be 1.3171, where I plan to take profit. If GBP/USD declines and bulls show no activity at 1.3024 in the second half of the day, downward pressure will resume. This could lead to a further decline and a retest of the 1.2975 support. Only a false breakout at that level would justify opening long positions. I plan to buy GBP/USD on a rebound from the 1.2941 low, targeting an upward correction of 30-35 points within the day.
For Opening Short Positions on GBP/USD:
Sellers are in no hurry to act, leaving room for a pound correction early in the week. However, bears need to stay below the 1.3078 resistance level. A false breakout at this level would be a good entry point for short positions, targeting a decline to the 1.3024 support— the weekly and monthly low. A breakout and retest from the bottom up would weaken buyers' positions, triggering stop orders and opening the path to 1.2975. The final target would be 1.2941, where I plan to take profit. Testing this level would further strengthen the bearish market. If GBP/USD rises and bears remain inactive at 1.3086 in the second half of the day, buyers will try to regain control of the market. Bears would then have no choice but to retreat to the 1.3131 resistance area, which may become the upper boundary of the sideways channel. I will sell there only on a false breakout. If there is no downward movement, I will look for short positions on a rebound from 1.3171, targeting a 30-35 point correction within the day.
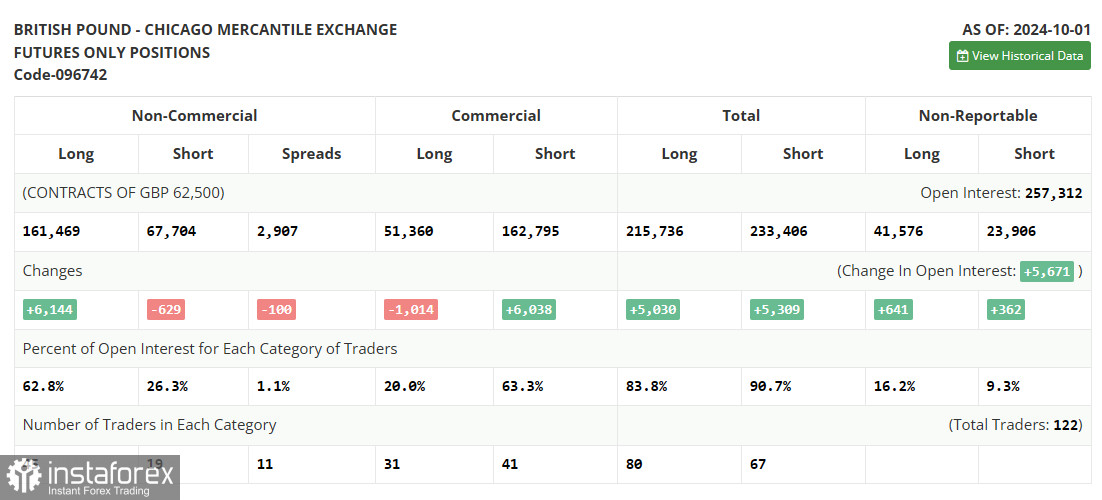
The COT report (Commitment of Traders) for October 1 showed an increase in long positions and a slight decrease in short positions. The recent UK statistics have posed additional challenges for further pound purchases, but there is little appetite for selling given the current indicators. However, keep in mind that this report does not account for the recent market changes that occurred late last week after the release of strong labor market data. Therefore, focusing too much on this report may not be useful. According to the latest COT report, long non-commercial positions increased by 6,144 to a total of 161,469, while short non-commercial positions fell by 629 to a total of 67,704. As a result, the gap between long and short positions narrowed by 100.
Indicator Signals:
Moving Averages:
The pair is trading around the 30 and 50-day moving averages, indicating a sideways market.
Note: The moving averages discussed here are based on the hourly H1 chart and differ from the daily moving averages typically used on the D1 chart.
Bollinger Bands:
If the pair declines, the lower boundary of the Bollinger Bands around 1.3040 will act as support.
Indicator Descriptions:
- Moving Average: Smooths volatility and noise to define the current trend. Period 50, marked in yellow on the chart.
- Moving Average: Smooths volatility and noise to define the current trend. Period 30, marked in green on the chart.
- MACD Indicator: Moving Average Convergence/Divergence (MACD). Fast EMA period 12, Slow EMA period 26, SMA period 9.
- Bollinger Bands: Standard deviation channels. Period 20.
- Non-commercial traders: Speculators like individual traders, hedge funds, and large institutions using the futures market for speculative purposes.
- Long Non-commercial Positions: The total long open positions held by non-commercial traders.
- Short Non-commercial Positions: The total short open positions held by non-commercial traders.
- Total Non-commercial Net Position: The difference between short and long positions of non-commercial traders.