empty
 
 
11.11.2024 03:17 AM
Trading Recommendations and Analysis for EUR/USD on November 11; No Strong Reasons for Euro Growth

EUR/USD 5-Minute Analysis

This image is no longer relevant

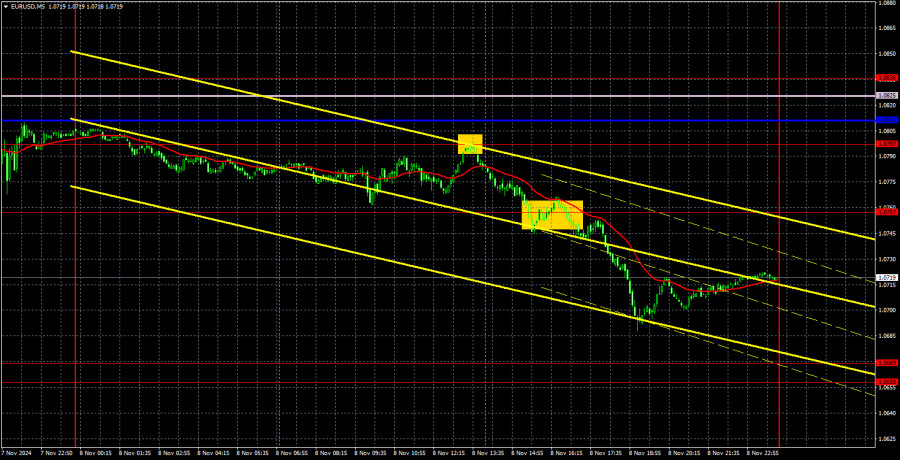
The EUR/USD currency pair traded with significant declines on Friday but failed to break below the previous local low. Theoretically, another wave of upward correction could occur in the next week or two. However, it's premature to identify a "double bottom" pattern as such formations rarely materialize in practice. While another correction for the euro is possible, there are no guarantees it will happen.

Notably, EUR/USD remains heavily influenced by a fundamental backdrop favoring sustained price declines. Technical indicators on higher time frames also support downward movement. The U.S. inflation report and Federal Reserve Chair Jerome Powell's speech are key events this week. Powell may comment on the inflation data, which, according to forecasts, could increase to 2.6% year-over-year. If inflation accelerates, it could prompt the Fed to refrain from lowering interest rates in December—a major supportive factor for the U.S. dollar. This would add pressure, as markets habitually expect rate cuts at every Fed meeting. Reality, however, suggests the Fed's stance is much less dovish.

On Friday, a bounce from the 1.0797 level triggered the decline. On its way down, the price also broke through 1.0757. Altogether, the pair fell 100 pips during the day, allowing traders to profit 70–80 pips from this signal.

COT Report

This image is no longer relevant

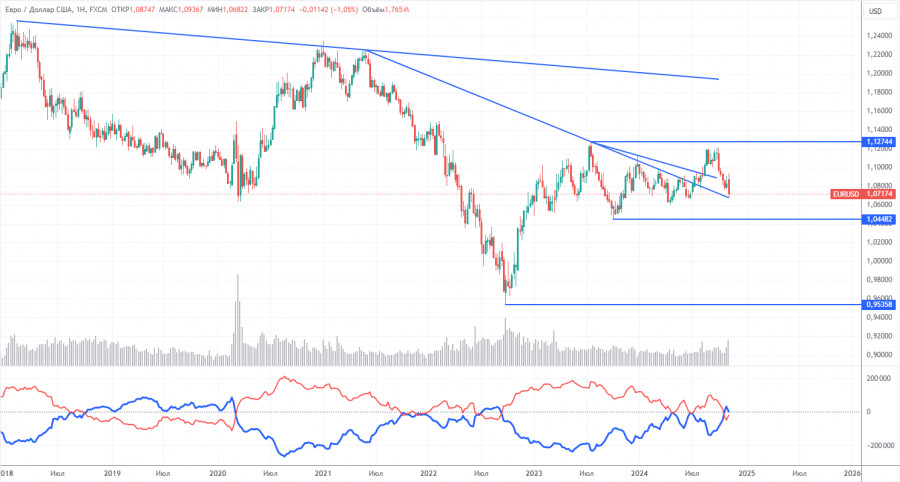
The latest Commitments of Traders (COT) report is dated November 5. The net position of non-commercial traders has long remained bullish, with bears failing to gain dominance. However, three weeks ago, professional traders significantly increased their short positions, turning the net position negative for the first time in a long while. This indicates that the euro is now being sold more frequently than bought.

We still see no fundamental factors supporting the euro's strength, while technical analysis indicates consolidation—a flat market. On the weekly time frame, the pair has been trading between 1.0448 and 1.1274 since December 2022, effectively transitioning from a 7-month to a 20-month range. A move toward 1.0448 remains more likely.

Currently, the red and blue lines have crossed and reversed positions. Over the last reporting week, the number of long positions in the non-commercial group increased by 600, while short positions decreased by 28,000, resulting in a net drop of 27,400. The euro still has strong potential for further declines.

EUR/USD 1-Hour Analysis

This image is no longer relevant

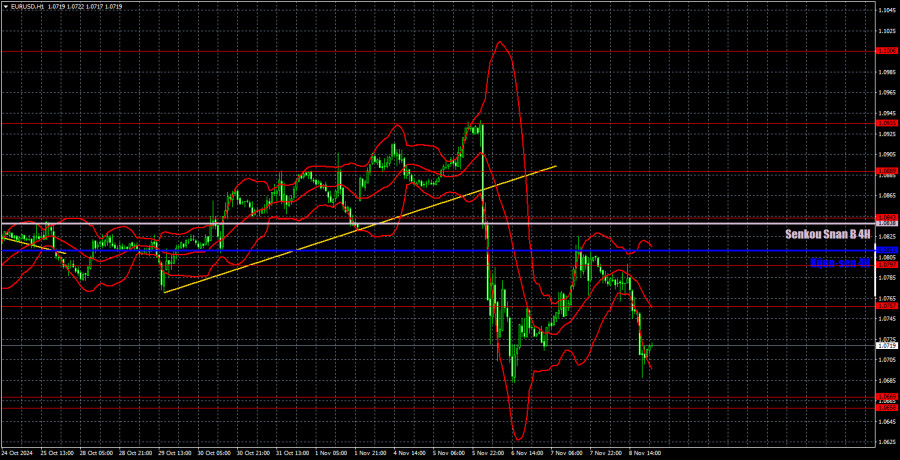
The pair attempted to continue its downward trend in the hourly time frame but failed to break the last low, leaving room for another correction. Fundamentally and macroeconomically, there are no medium-term reasons for the euro's rise. In the medium term, we expect the euro to continue falling. Every day, it becomes increasingly clear that the market has priced in an overly dovish Fed scenario.

For November 11, the following levels are key for trading: 1.0658-1.0669, 1.0757, 1.0797, 1.0843, 1.0889, 1.0935, 1.1006, 1.1092, 1.1147, along with the Senkou Span B (1.0838) and Kijun-sen (1.0811) lines. The Ichimoku indicator lines may shift during the day, so consider this when identifying trading signals. Remember to place a Stop Loss at breakeven after a 15-pip move in the intended direction to mitigate potential losses if the signal proves false.

No significant events are scheduled in the EU or U.S. on Monday, so we anticipate quiet, low-volatility trading. Recently, market volatility has increased significantly, enabling traders to capitalize on intraday movements regularly.

Chart Explanations:

Support and resistance levels: thick red lines around which movement may end. They are not sources of trading signals.

Kijun-sen and Senkou Span B lines: Ichimoku indicator lines transferred from the 4-hour to the 1-hour timeframe. These are strong lines.

Extreme levels: thin red lines where the price previously rebounded. They are sources of trading signals.

Yellow lines: Trend lines, trend channels, and other technical patterns.

Indicator 1 on COT charts: The net position size for each category of traders.

Paolo Greco,
Especialista em análise na InstaForex
© 2007-2024
Ganhe com as variações das taxas das criptomoedas com a InstaForex.
Baixe o MetaTrader 4 e abra a sua primeira operação.
  • Grand Choice
    Contest by
    InstaForex
    InstaForex always strives to help you
    fulfill your biggest dreams.
    PARTICIPE DO CONCURSO
  • Chancy Deposit
    Deposite US $ 3.000 em sua conta e receba $6000 mais!
    Em Dezembro nós sorteamos $6000 na campanha Chancy Deposit!
    Tenha a chance de ganhar, depositando $3,000 em sua conta de negociação. Após cumprir essa condição, você se torna um participante da campanha.
    PARTICIPE DO CONCURSO
  • Trade Wise, Win Device
    Abasteça a sua conta com pelo menos $500, inscreva-se no concurso e tenha a chance de ganhar dispositivos móveis.
    PARTICIPE DO CONCURSO
  • Bônus de 100%
    Sua oportunidade única de receber um bônus de 100% em seu depósito
    RECEBA O BÔNUS
  • Bônus de 55%
    Solicite um bônus de 55% em cada depósito
    RECEBA O BÔNUS
  • Bônus de 30%
    Receba um bônus de 30% toda vez que você fizer um depósito em sua conta
    RECEBA O BÔNUS

Recommended Stories

Não pode falar agora?
Faça sua pergunta no chat.
Widget callback