EUR/USD 5-Minute Analysis
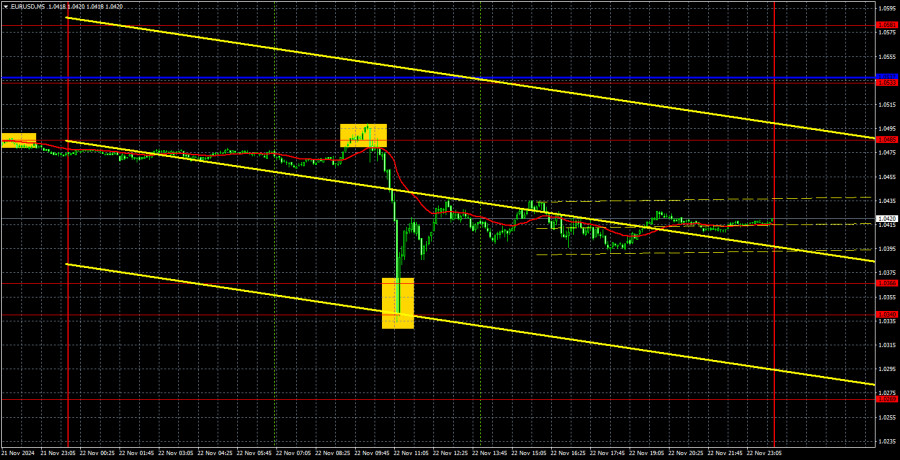
On Friday, the EUR/USD currency pair continued its downward movement. To be more precise, during the European trading session, the price plummeted by 150 pips. By the end of the day, the euro slightly recovered, but this had little impact overall. At this point, we are almost daily repeating that the "euro trades lower." The descending trend line signals the continuation of the bearish trend, and the market appears willing to sell the euro even on relatively weak news. Nobody seriously believes that business activity indices triggered a 150-pip drop.
Indeed, all four key business activity indices in the Eurozone and Germany were weaker than expected, while U.S. indices exceeded forecasts. However, it's rare for weak business indices to cause such a significant decline.
The euro's challenges remain tied to the same fundamental factors we've highlighted countless times. These factors continue to weigh on the currency and could persist for an extended period. The euro now seems reliant solely on rebounding from the lower boundary of the horizontal channel on the weekly timeframe.
On the 5-minute timeframe, Friday saw the price bounce off the 1.0485 level and later the 1.0340–1.0366 range. Trading a buy signal during such a strong bearish trend was likely ill-advised, but due to high volatility, even that would have allowed traders to gain around 30–50 pips. The first signal, however, could have yielded about 85 pips, at minimum.
COT Report
The latest COT (Commitment of Traders) report, dated November 19, shows that non-commercial traders' net position has been bullish for a long time, though bears are gradually gaining dominance. A month ago, the number of short positions held by professional traders surged, flipping the net position negative for the first time. This indicates that the euro is now being sold more frequently than bought.
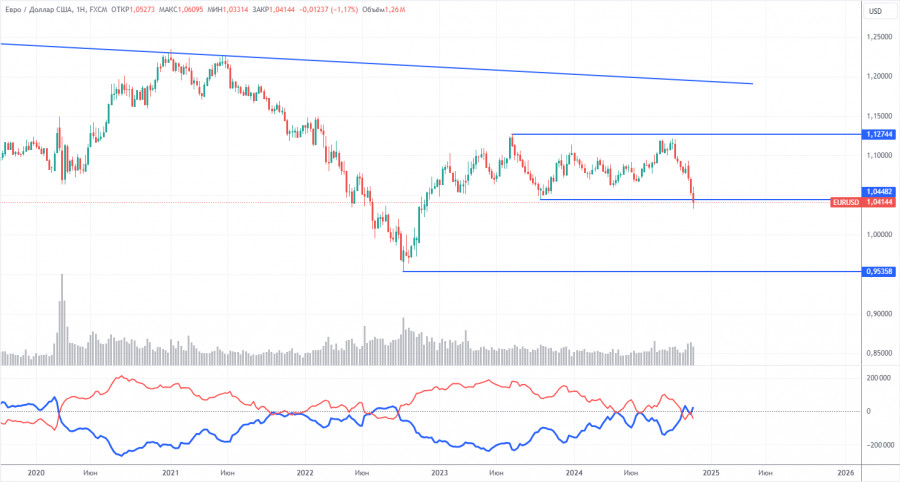
We still see no fundamental factors supporting the euro's strength, and technical analysis suggests the pair is stuck in a consolidation phase—or, simply put, a flat trend. The weekly timeframe shows that the pair has been trading between 1.0448 and 1.1274 since December 2022. This makes further declines even more likely, and a break below 1.0448 would open the door for more significant losses.
Currently, the red and blue lines in the COT chart have crossed, reversing their positions relative to one another. During the last reporting week, the number of long positions in the non-commercial group decreased by 5,700, while short positions increased by 29,400. As a result, the net position fell by an additional 35,100 contracts.
EUR/USD 1-Hour Analysis
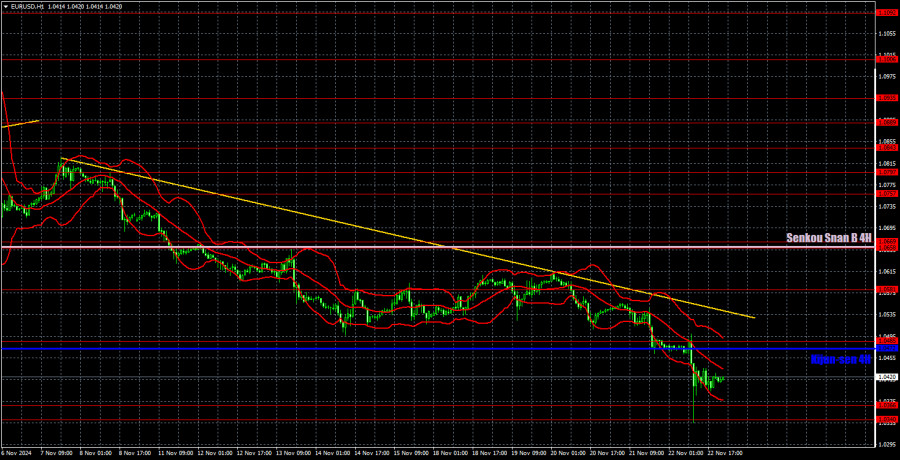
On the hourly timeframe, the pair maintains a clear downtrend. Discussing the fundamental and macroeconomic drivers behind the dollar's medium-term decline is pointless—they do not exist. The euro isn't just falling—it's tumbling. For the medium term, we anticipate nothing but further declines. It's becoming increasingly evident that the market has fully priced in the Federal Reserve's monetary easing cycle, and now the Fed is showing no rush to lower interest rates further. At this point, the euro can only hope for a correction, but even a modest upward move seems challenging.
For November 25, we identify the following levels for trading: 1.0269, 1.0340–1.0366, 1.0485, 1.0581, 1.0658–1.0669, 1.0757, 1.0797, 1.0843, 1.0889, 1.0935, and the Senkou Span B (1.0658) and Kijun-sen (1.0472) lines. The Ichimoku indicator lines can shift throughout the day and should be considered when determining trading signals. Remember to set Stop Loss orders at breakeven if the price moves 15 pips in the desired direction to protect against potential losses from false signals.
No significant events or reports are scheduled in the Eurozone or the U.S. on Monday. While this might suggest a quieter trading day, it does not rule out price movement entirely. Traders should remain alert and monitor new sell signals closely.
Illustration Explanations:
- Support and Resistance Levels (thick red lines): Key areas where price movement might stall. Not sources of trading signals.
- Kijun-sen and Senkou Span B Lines: Ichimoku indicator lines transferred from the H4 timeframe to the hourly chart, serving as strong levels.
- Extreme Levels (thin red lines): Points where the price has previously rebounded. They can serve as trading signal sources.
- Yellow Lines: Trendlines, channels, or other technical patterns.
- Indicator 1 on COT Charts: Reflects the net position size of each trader category.


