


signal strength 3 of 5
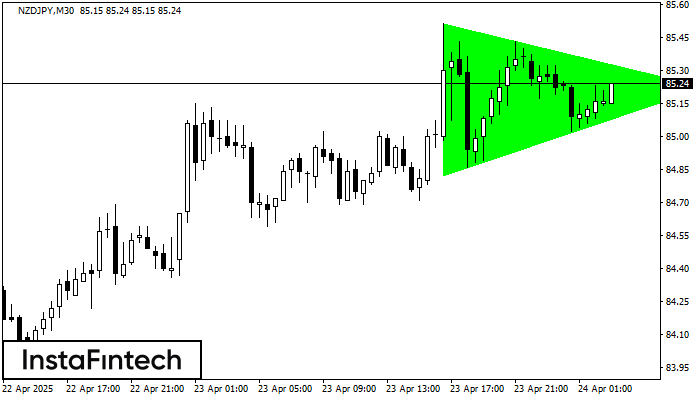
According to the chart of M30, NZDJPY formed the Bullish Symmetrical Triangle pattern, which signals the trend will continue. Description. The upper border of the pattern touches the coordinates 85.51/85.22 whereas the lower border goes across 84.82/85.22. The pattern width is measured on the chart at 69 pips. If the Bullish Symmetrical Triangle pattern is in progress during the upward trend, this indicates the current trend will go on. In case 85.22 is broken, the price could continue its move toward 85.52.
- All
- Double Top
- Flag
- Head and Shoulders
- Pennant
- Rectangle
- Triangle
- Triple top
- All
- #AAPL
- #AMZN
- #Bitcoin
- #EBAY
- #FB
- #GOOG
- #INTC
- #KO
- #MA
- #MCD
- #MSFT
- #NTDOY
- #PEP
- #TSLA
- #TWTR
- AUDCAD
- AUDCHF
- AUDJPY
- AUDUSD
- EURCAD
- EURCHF
- EURGBP
- EURJPY
- EURNZD
- EURRUB
- EURUSD
- GBPAUD
- GBPCHF
- GBPJPY
- GBPUSD
- GOLD
- NZDCAD
- NZDCHF
- NZDJPY
- NZDUSD
- SILVER
- USDCAD
- USDCHF
- USDJPY
- USDRUB
- All
- M5
- M15
- M30
- H1
- D1
- All
- Buy
- Sale
- All
- 1
- 2
- 3
- 4
- 5
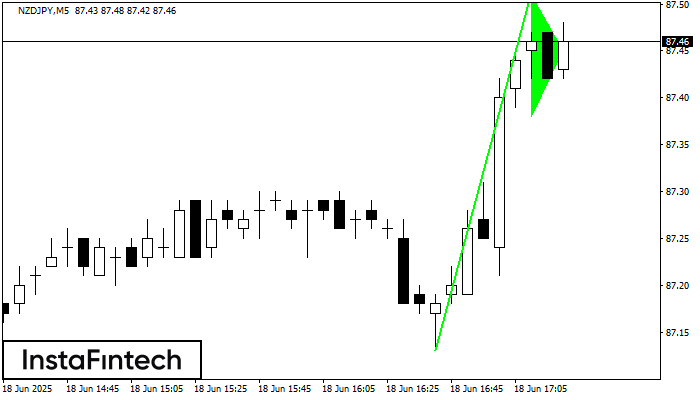
O padrão Pennant de alta é formado no gráfico NZDJPY M5. Ele é um tipo do padrão de continuação. Supostamente, se o preço for fixado acima da alta de 87.51
Os intervalos M5 e M15 podem ter mais pontos de entrada falsos.
Open chart in a new window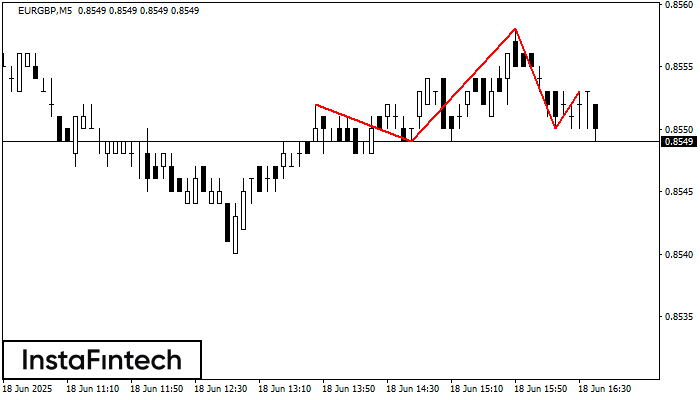
O padrão técnico chamado Cabeça & Ombros apareceu no gráfico de EURGBP M5. Há razões de peso para sugerir que o preço ultrapassará a Linha do Pescoço 0.8549/0.8550 após
Os intervalos M5 e M15 podem ter mais pontos de entrada falsos.
Open chart in a new window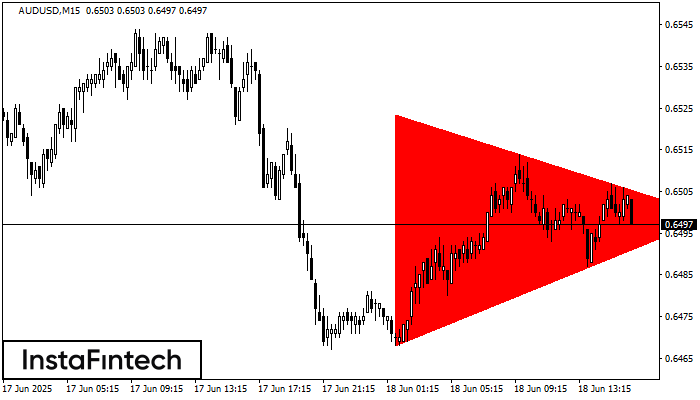
De acordo com o gráfico de M15, AUDUSD formou o padrão Triângulo Simétrico de Baixa. Descrição: o limite inferior é 0.6468/0.6499 e o limite superior é 0.6523/0.6499. A largura
Os intervalos M5 e M15 podem ter mais pontos de entrada falsos.
Open chart in a new window


