

signal strength 1 of 5
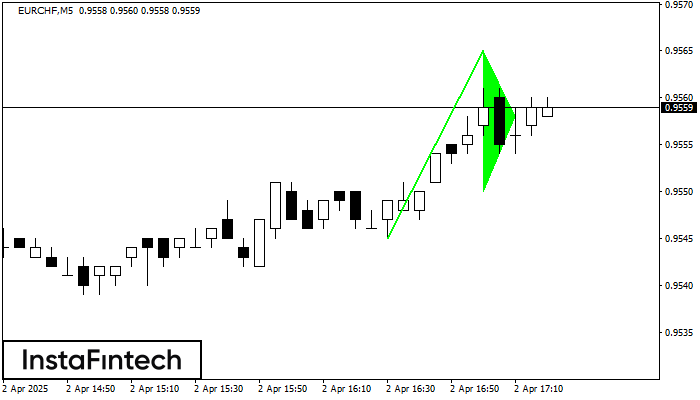
The Bullish pennant graphic pattern has formed on the EURCHF M5 instrument. This pattern type falls under the category of continuation patterns. In this case, if the quote can breaks out high, is expected to continue the upward trend to level 0.9580.
The M5 and M15 time frames may have more false entry points.
See Also
- All
- Double Top
- Flag
- Head and Shoulders
- Pennant
- Rectangle
- Triangle
- Triple top
- All
- #AAPL
- #AMZN
- #Bitcoin
- #EBAY
- #FB
- #GOOG
- #INTC
- #KO
- #MA
- #MCD
- #MSFT
- #NTDOY
- #PEP
- #TSLA
- #TWTR
- AUDCAD
- AUDCHF
- AUDJPY
- AUDUSD
- EURCAD
- EURCHF
- EURGBP
- EURJPY
- EURNZD
- EURRUB
- EURUSD
- GBPAUD
- GBPCHF
- GBPJPY
- GBPUSD
- GOLD
- NZDCAD
- NZDCHF
- NZDJPY
- NZDUSD
- SILVER
- USDCAD
- USDCHF
- USDJPY
- USDRUB
- All
- M5
- M15
- M30
- H1
- D1
- All
- Buy
- Sale
- All
- 1
- 2
- 3
- 4
- 5
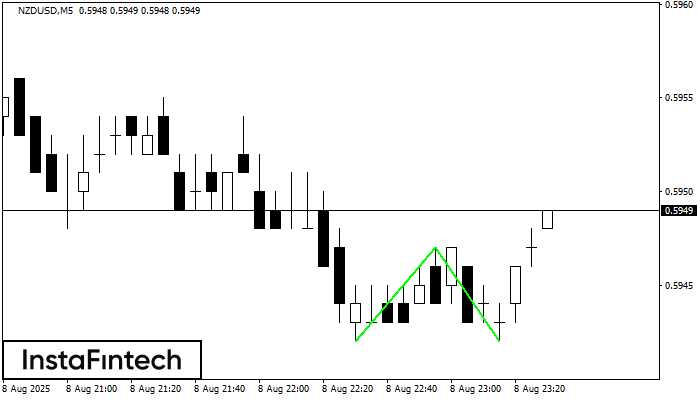
The Double Bottom pattern has been formed on NZDUSD M5; the upper boundary is 0.5947; the lower boundary is 0.5942. The width of the pattern is 5 points. In case
The M5 and M15 time frames may have more false entry points.
Открыть график инструмента в новом окне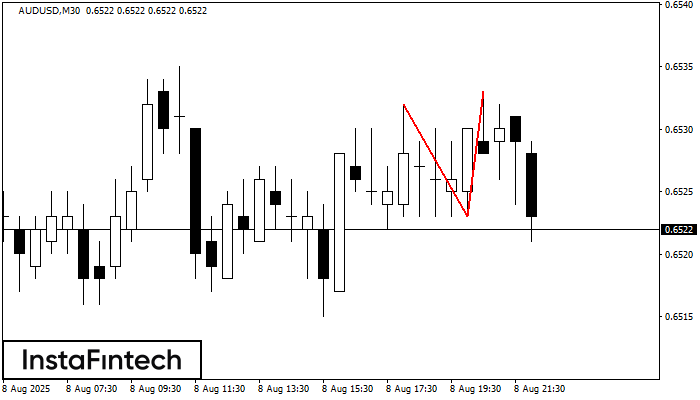
The Double Top pattern has been formed on AUDUSD M30. It signals that the trend has been changed from upwards to downwards. Probably, if the base of the pattern 0.6523
Открыть график инструмента в новом окне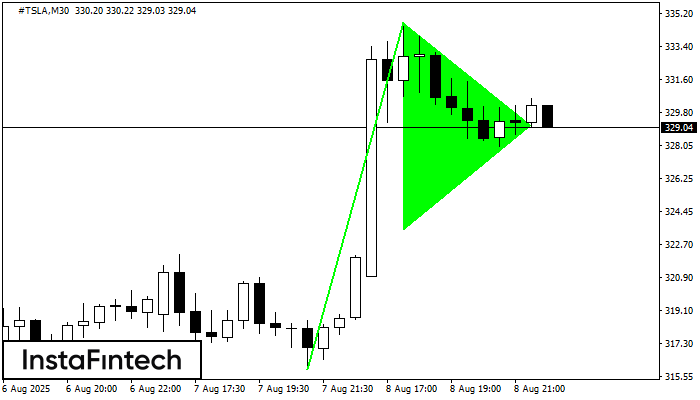
The Bullish pennant pattern is formed on the #TSLA M30 chart. It is a type of the continuation pattern. Supposedly, in case the price is fixed above the pennant’s high
Открыть график инструмента в новом окне


