empty
19.12.2024 05:18 AM
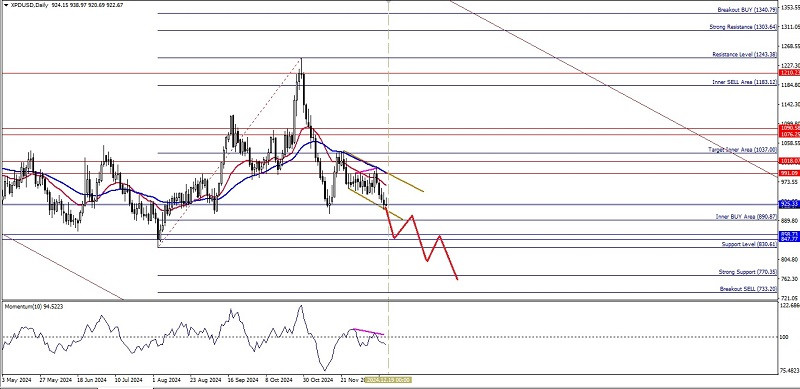
Technical Analysis of Daily Price Movement of Palladium Commodity Asset, Wednesday December 18, 2024.

This image is no longer relevant

From what is seen on the 4-hour chart of the Palladium commodity asset, it appears that the EMA 21 is below the WMA 55 which indicates a Death Cross condition followed by the appearance of hidden deviations between the XPD/USD price movement and the Momentum indicator (10) where all of these movements are within the XPD/USD weekly Bearish Pitchfork Channel so that based on these facts in the next few days, Palladium has the potential to continue its weakening to the level of 890.87 if this level is successfully broken and closed below it by XPD/USD then the weakening will continue to the level of 830.61 and if the momentum and volatility support it then the level of 770.35 will be the next target to be aimed for but all of these weakening scenarios will become invalid and automatically canceled if on the way to the target levels there is a significant strengthening especially if it breaks through and closes above the level of 991.09.

(Disclaimer)

Seleccione el marco de tiempo
5
min
15
min
30
min
1
hora
4
horas
1
día
1
s.
Gana con los cambios en el valor de las criptomonedas con InstaForex.
Descarga MetaTrader 4 y abre tu primera operación.
  • Depósito al azar
    ¡Haga un depósito en su cuenta de $3,000 y obtenga $6000 más!
    ¡En Diciembre, sorteamos $6000 dentro de la campaña Depósito afortunado!
    Obtenga la oportunidad de ganar depositando $3,000 en una cuenta de operaciones. Tras haber cumplido esta condición, se convertirá en un participante de la campaña.
    UNIRSE AL CONCURSO

Recommended Stories

Análisis técnico para la semana del 16 al 21 de diciembre, del par de divisas GBP/USD.

La semana pasada, el par, moviéndose hacia abajo, rompió el nivel de retroceso del 14,6% – 1,2624 (línea de puntos azul), cerrando la vela semanal en 1,2618. Durante la próxima

Stefan Doll 09:17 2024-12-16 UTC+2

EUR/USD. 10 de diciembre. Los toros agotaron su potencial.

Buenos días, estimados traders. El par EUR/USD el lunes realizó un rebote desde el nivel de corrección del 323,6% – 1,0532, una ligera subida y un regreso al nivel 1,0532

Samir Klishi 11:31 2024-12-10 UTC+2

GBP/USD. 10 de diciembre. La libra está estancada y esperando la inflación estadounidense

Buenos días, estimados traders. En el marco temporal de una hora, el par GBP/USD el lunes volvió a la zona de resistencia 1,2788–1,2801, rebotó desde ella, giró a favor

Samir Klishi 11:31 2024-12-10 UTC+2

Pronóstico para el par EUR/USD del 24 de junio de 2024

EUR/USD La caída del euro del viernes no fue grande, pero sí cualitativa: los índices bursátiles, las materias primas y los metales preciosos bajaron junto con él. El par EUR/USD

Laurie Bailey 09:00 2024-06-24 UTC+2

Pronóstico del par GBP/USD para el 24 de junio de 2024

GBP/USD La libra esterlina bajó 13 pips el viernes. Se detuvo en la línea Kruzenshtern de la escala diaria. Esta mañana el precio se está consolidando en esta línea, probablemente

Laurie Bailey 08:53 2024-06-24 UTC+2

Pronóstico del par USD/JPY para el 24 de junio de 2024

USD/JPY El viernes, el dólar repitió el carácter impulsivo de la subida del jueves, saltando 86 pips. El nivel objetivo de 160,40 ya está cerca, y supera el máximo

Laurie Bailey 08:40 2024-06-24 UTC+2

Análisis técnico para la semana, del 20 al 25 de mayo, par de divisas GBP/USD

La semana pasada el par subió, rompió el nivel de retroceso del 23,6%, 1,2690 (línea de puntos azul) y subió, cerrando la vela semanal en 1,2697. En la próxima semana

Stefan Doll 10:32 2024-05-20 UTC+2

Análisis técnico para la semana, del 20 al 25 de mayo, par de divisas EUR/USD

La semana pasada, el par se movió al alza, probó el nivel de retroceso del 76,4%, 1,0891 (línea de puntos roja), bajó un poco y cerró la vela semanal

Stefan Doll 10:32 2024-05-20 UTC+2

EUR/USD. 7 de mayo. La fuerza de los toros se está agotando

¡Buenas tardes, queridos traders! El par EUR/USD volvió el lunes a la zona de resistencia de 1,0785-1,0797, que forma parte de la zona de resistencia más amplia de 1,0764-1,0806

Samir Klishi 12:10 2024-05-07 UTC+2

EUR/USD y GBP/USD el 26 de abril - análisis técnico de la situación

Ayer, los alcistas siguieron ganando terreno. La zona de resistencia más cercana sigue siendo el área de 1,0744 - 1,0756, que combina los niveles diarios y semanales. En caso

Evangelos Poulakis 12:51 2024-04-26 UTC+2
¿No puede hablar ahora mismo?
Ingrese su pregunta en el chat.
Widget callback
 

Dear visitor,

Your IP address shows that you are currently located in the USA. If you are a resident of the United States, you are prohibited from using the services of InstaFintech Group including online trading, online transfers, deposit/withdrawal of funds, etc.

If you think you are seeing this message by mistake and your location is not the US, kindly proceed to the website. Otherwise, you must leave the website in order to comply with government restrictions.

Why does your IP address show your location as the USA?

  • - you are using a VPN provided by a hosting company based in the United States;
  • - your IP does not have proper WHOIS records;
  • - an error occurred in the WHOIS geolocation database.

Please confirm whether you are a US resident or not by clicking the relevant button below. If you choose the wrong option, being a US resident, you will not be able to open an account with InstaForex anyway.

We are sorry for any inconvenience caused by this message.