Here are the details of the economic calendar for November 16, 2021:
The UK labor market data was published yesterday, where the unemployment rate declined from 4.5% to 4.3%. In turn, employment in the country increased by 247 thousand in September.
The figures for England kept the pound sterling from falling.
As for Europe, another estimate of GDP for the 3rd quarter was published, where the pace of economic growth slowed from 14.2% to 3.7%. It is worth considering that the result coincided with the previous assessment. For this reason, the statistics did not attract much attention from market participants.
There was a speculative interest in dollar positions during the American trading session, which was caused by the US retail sales data. So, sales in annual terms were expected to slow down from 13.9% to 12.0%, but instead, there was an acceleration to 16.31%. At the same time, the previous data were revised in favor of growth from 13.9% to 14.26%.
Analysis of trading charts from November 16:
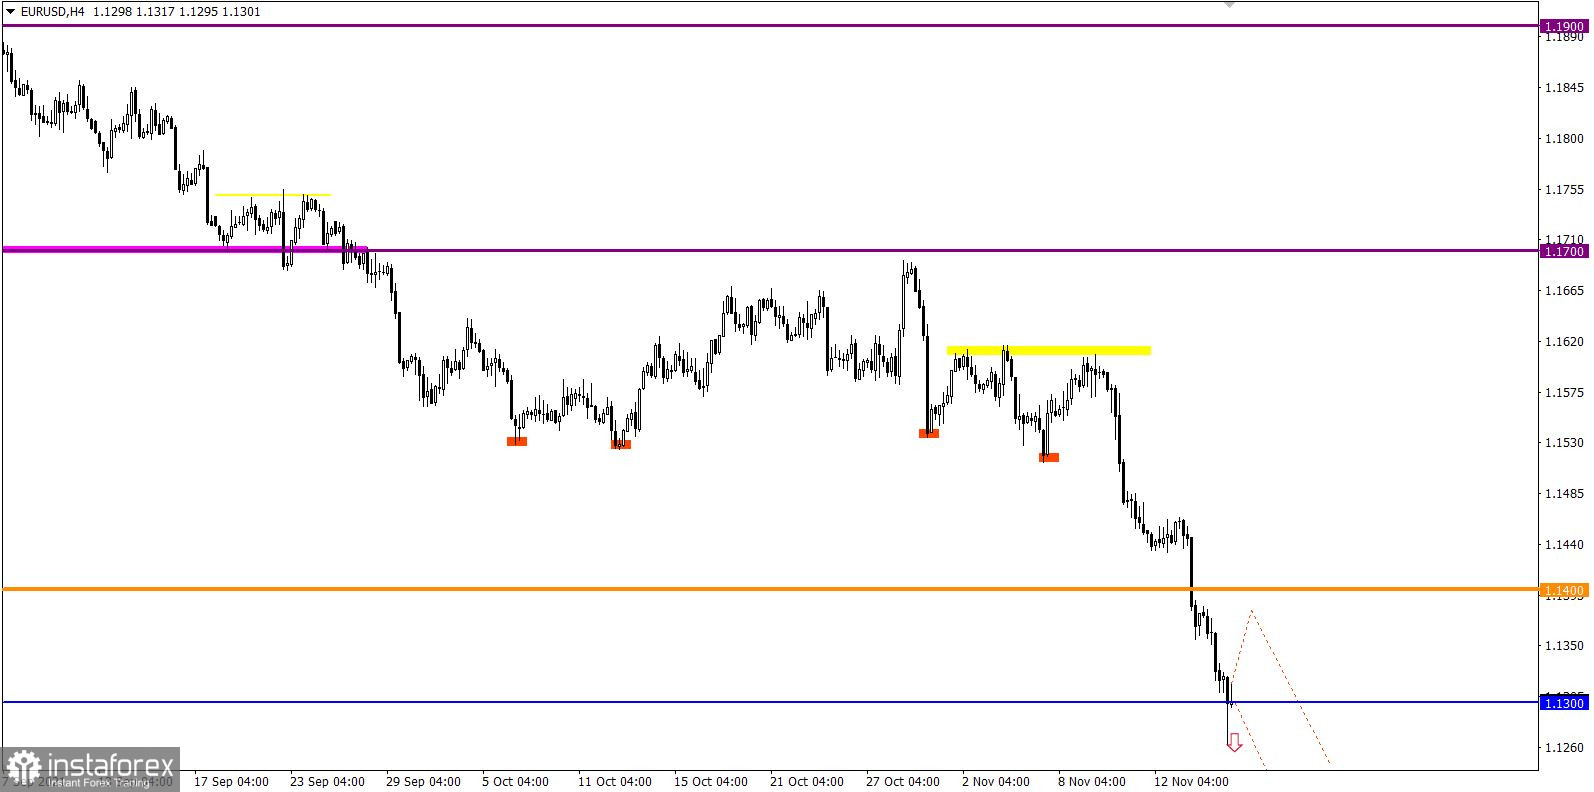
The Euro currency has lost more than 300 points in value in 5 trading days. This is a strong price change in a short period of time, which signals that the euro is oversold.
Previously, selling positions were considered in case the price is kept below the level of 1.1350. This made it possible to enter the market at the most appropriate moment. As a result, it was possible to earn at least 50 points ($50 with a transaction volume of 1InstaLot).
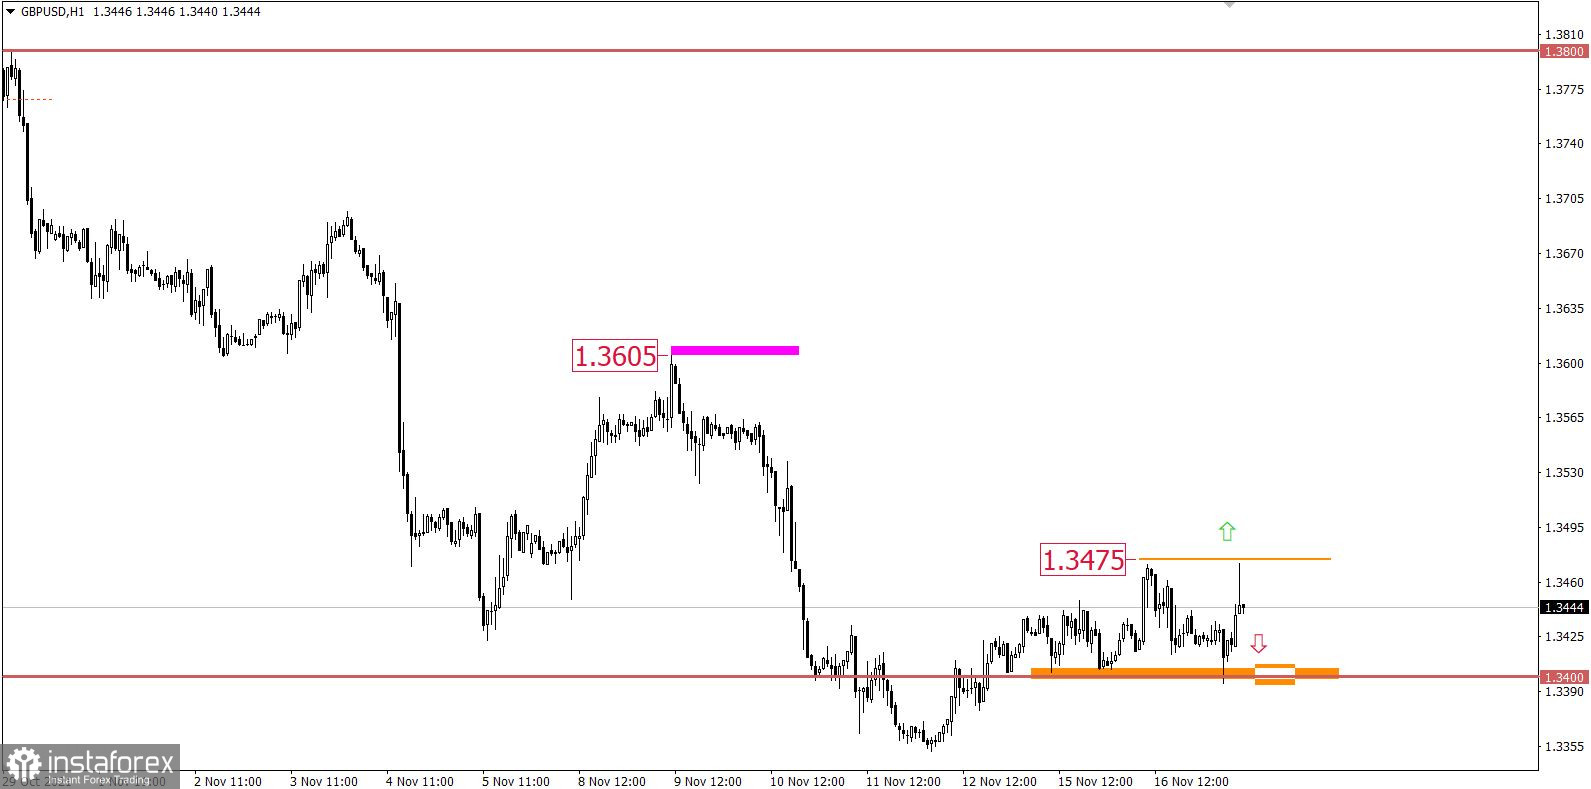
The GBP/USD pair adheres to the correction scheme from the variable pivot point of 1.3350, despite the fact that there has been a characteristic stagnation within the borders of 1.3400/1.3450 since the beginning of the trading week.
As before, the market has a downward cycle despite the corrective course and the stagnation stage, which refers to the medium term. In this case, having price changes are only local manifestations of the market.
November 17 economic calendar:
The UK's inflation data was published at 7:00 Universal time today, where the level of consumer prices rose from 3.1% to 4.2% against the forecast of 3.7%. Such significant inflation growth is not the best signal for investors, as it entails a tightening of monetary policy.
In this case, the speculative mood of traders played a role. The value of the pound sterling locally increased.
Meanwhile, the EU's inflation data will be released at 10:00 Universal time, where its level may coincide with the preliminary estimate of 4.1%. It is unlikely that this will put pressure on the market if expectations coincide.
During the US trading session, America's construction sector data is to be published, where they predict an increase in indicators, which is considered a good signal. This may lead to a strengthening of dollar positions.
Trading plan for EUR/USD on November 17:
With the opening of the Asian session, speculation on the US dollar resumed. The quote of the EUR/USD pair declined to the level of 1.1263, where there was a sharp reduction in the volume of short positions. This led to a technical pullback towards the level of 1.1317. It can be assumed that the downward interest will continue in the market, where keeping the price below 1.1300 will increase the chances of speculators for a further decline.
Traders will consider an alternative scenario of market development if the pullback is replaced by a full-size correction.
Trading plan for GBP/USD on November 17:
The pound is showing increased speculative interest, but market participants have not yet managed to prolong the corrective course. So, the quote needs to stay above the level of 1.3475 at least in an hourly period in order for a subsequent increase in the volume of long positions to occur. Otherwise, the quote may return to the level of 1.3400.
What is reflected in the trading charts?
A candlestick chart view is graphical rectangles of white and black light, with sticks on top and bottom. When analyzing each candle in detail, you will see its characteristics of a relative period: the opening price, closing price, and maximum and minimum prices.
Horizontal levels are price coordinates, relative to which a stop or a price reversal may occur. These levels are called support and resistance in the market.
Circles and rectangles are highlighted examples where the price of the story unfolded. This color selection indicates horizontal lines that may put pressure on the quote in the future.
The up/down arrows are the reference points of the possible price direction in the future.