empty
04.01.2022 12:05 PM
EUR/USD analysis and forecast for January 4, 2022

Yesterday's trading on the main currency pair of the Forex market both began and ended with a decline, contrary to preliminary forecasts of a likely increase after pullbacks down. Well, in more detail, as promised yesterday, we will analyze smaller time intervals. However, for now, let's briefly talk about today's macroeconomic events. First of all, I would like to draw your attention again that the fundamental component is not always taken into account and recouped by the market. As another typical example of this factor, yesterday's data from the United States on the index of business activity in the manufacturing sector and construction costs can be cited. It is noteworthy that both indicators came out in the red zone, that is, worse than the forecast values. However, this did not prevent the US dollar from noticeably strengthening its position against the single European currency.

Retail sales data in Germany have already been published today, both seasonally adjusted and without taking into account those. Both indicators exceeded economists' expectations and turned out to be stronger than forecasts. Nevertheless, at this stage of time, it did not bring the European currency much-needed and significant support. And this is another example when the "foundation" is not completely and far from always taken into account by the market. Later, at 15:00 London time, data from the States on the level of vacancies and labor turnover will be released, and the production index of the Institute of Supply Management (ISM) will also be published. I can't say that these are very important indicators, but they can't be attributed to being too weak either. Let's see if they will have an impact on the price dynamics of EUR/USD, but for now we turn to the technical picture.

Daily

This image is no longer relevant

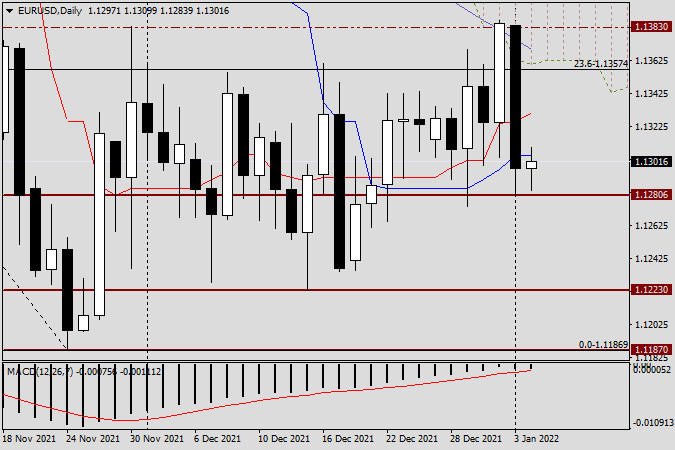
As already noted at the beginning of this article, on the first trading day of the new year, the pair showed a fairly strong bearish dynamic. Of course, you can always find some explanation for any price movement, whether it's the notorious COVID-19 strain called "Omicron" or a change in the yield of US treasuries, or some other supposedly significant reason. In my personal opinion, the main factor in yesterday's strengthening of the US dollar against the euro was (as most often happens) the technical component. And on the daily chart, at least three obstacles are clearly visible, which did not let the pair go higher and turned it in a southerly direction. First, this is the resistance level of 1.1383, over which the euro bulls failed to consolidate trading, which once again underlines the strength of this resistance of sellers. Second, the 50 simple moving average and the lower boundary of the daily cloud of the Ichimoku indicator played their role as resistance.

Another bearish positive moment was the closing of yesterday's trading below the red Tenkan line and the blue Kijun line of the Ichimoku indicator, which had previously, and more than once, provided EUR/USD with strong support. So, as a result of yesterday's not weak decline, the pair ended trading below the most important technical level of 1.1300. At the end of this article, the euro/dollar is trying to adjust to yesterday's decline and is strengthening slightly. If today's session closes above the Kijun and Tenkan lines, their breakdown can be considered false and prepare for another test for the breakdown of a strong resistance zone of 1.1383/85. Task No. 1 for players to lower the exchange rate will be to update yesterday's lows at 1.1280 and close trading under this support level, if this condition is met, the road will open for the euro/dollar to the levels of 1.1230, 1.1200 and, possibly, to the key support level of 1.1187.

H1

This image is no longer relevant

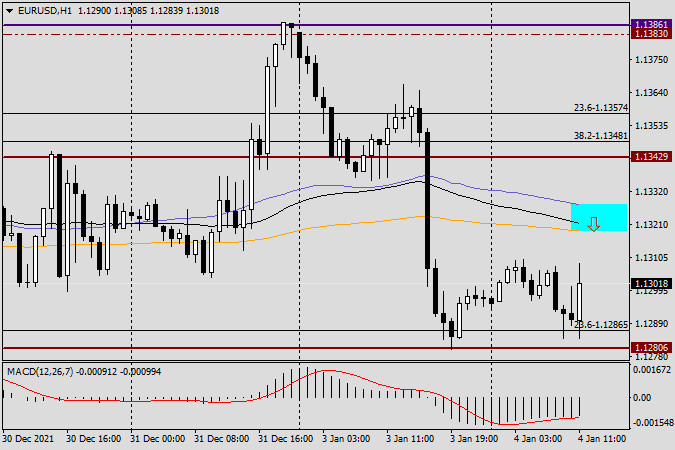
On the hourly chart, at the very end of the article, we observe a very active and quite strong growth. Most likely, the pair will rise to the moving averages used and broken the day before, which are in the circled zone 1.1319-1.1327. If a candle or a combination of bearish reversal candles appears in the selected zone on this or four-hour charts, it can be perceived as a signal to open sales. Given yesterday's strong decline and the closing of trading under the most important mark of 1.1300, in the current situation with purchases, it is better to wait and see how today's trading ends. I fully admit that taking into account the closing of today's session and the formed daily candle, we can get answers to our questions about the further direction of the quote. So far, somehow.

Seleccione el marco de tiempo
5
min
15
min
30
min
1
hora
4
horas
1
día
1
s.
Gana con los cambios en el valor de las criptomonedas con InstaForex.
Descarga MetaTrader 4 y abre tu primera operación.
  • Grand Choice
    Contest by
    InstaForex
    InstaForex always strives to help you
    fulfill your biggest dreams.
    UNIRSE AL CONCURSO

Recommended Stories

EUR/USD. El 12 de mayo. El conflicto en Ucrania podría llegar a su fin.

Buenos días, estimados traders. El par EUR/USD el viernes subió hacia la zona de resistencia 1,1265 – 1,1282, rebotó desde allí y giró a favor del dólar estadounidense. El proceso

Samir Klishi 10:27 2025-05-12 UTC+2

Pronóstico para el gas al 8 de abril de 2025

Gas natural (NG) Ni al final de la semana pasada, ni mucho menos al comienzo de la actual, la cotización del gas natural logró superar la resistencia de 4.200, reforzada

Laurie Bailey 08:11 2025-04-08 UTC+2

Pronóstico del gas para el 17 de marzo de 2025

Gas natural (NG) La jornada de hoy se abrió por encima de la línea indicadora Kruzenshtern en el marco diario. Al mismo tiempo, el oscilador Marlin cambió de dirección hacia

Laurie Bailey 07:02 2025-03-17 UTC+2

Pronóstico para el Bitcoin el 21 de febrero de 2025

Bitcoin El Bitcoin ha cambiado de opinión sobre el desarrollo de una caída hacia soportes objetivos cómodos, y en su lugar, siguiendo el sentimiento de riesgo general, ha revertido desde

Laurie Bailey 07:23 2025-02-21 UTC+2

Bitcoin - análisis técnico de la situación

Viernes, y el Bitcoin sigue esperando. Ninguna de las partes enfrentadas tiene prisa por presentarse y ser activa. En la incertidumbre actual, el posicionamiento de los principales índices de referencia

Evangelos Poulakis 07:45 2025-02-14 UTC+2

Previsión para el gas natural (GN) del 5 de febrero de 2025

En el gráfico semanal la semana pasada el precio se revirtió desde el nivel de soporte 3.017 - desde los máximos de septiembre 2024, agosto 2023, febrero 2023 y también

Laurie Bailey 07:51 2025-02-05 UTC+2

#NDX - análisis técnico de la situación

A finales del año pasado, el índice marcó un nuevo máximo histórico (22141), tras lo cual se detuvo la subida, comenzó la formación de la corrección y la consolidación. Ahora

Evangelos Poulakis 07:24 2025-02-04 UTC+2

Bitcoin 30 Enero - análisis técnico de la situación

A pesar de marcar un nuevo máximo la semana pasada (109986), el Bitcoin detuvo su tendencia alcista y comenzó a formar incertidumbre. Hasta ahora, el formato semanal ha proyectado

Evangelos Poulakis 07:24 2025-01-30 UTC+2

#SPX (contrato CFD sobre futuros del SP500). Esperamos que la subida continúe

El contrato CFD sobre futuros del S&P 500 se recupera vigorosamente tras una caída local del lunes por la oleada de noticias sobre el éxito de la empresa china DeepSeek

Pati Gani 11:06 2025-01-29 UTC+2

Nasdaq 100. Se esperan nuevos máximos históricos

La toma de posesión hoy de Donald Trump marcará el inicio del segundo mandato de su presidencia, acompañado de promesas de reforzar la posición de EE. UU. en la escena

Anna Zotova 10:00 2025-01-20 UTC+2
¿No puede hablar ahora mismo?
Ingrese su pregunta en el chat.
Widget callback
 

Dear visitor,

Your IP address shows that you are currently located in the USA. If you are a resident of the United States, you are prohibited from using the services of InstaFintech Group including online trading, online transfers, deposit/withdrawal of funds, etc.

If you think you are seeing this message by mistake and your location is not the US, kindly proceed to the website. Otherwise, you must leave the website in order to comply with government restrictions.

Why does your IP address show your location as the USA?

  • - you are using a VPN provided by a hosting company based in the United States;
  • - your IP does not have proper WHOIS records;
  • - an error occurred in the WHOIS geolocation database.

Please confirm whether you are a US resident or not by clicking the relevant button below. If you choose the wrong option, being a US resident, you will not be able to open an account with InstaForex anyway.

We are sorry for any inconvenience caused by this message.