In my morning article, I turned your attention to several levels. However, GBP/USD actually failed to touch any of them. The currency pair is trading under low volatility despite a weak UK manufacturing PMI for March that grew worse than expected. The sterling did not take a nosedive. It proves that traders are focused on US macroeconomic reports that are due later in the trading day. These reports will set the tone in the second half of the day. GBP/USD did not test 1.3106 and 1.3142 and did not suggest any market entry points. The technical picture and a trading strategy remain the same for the second half of the day.
What is needed to open long positions on GBP/USD
As I mentioned above, the UK manufacturing PMI for March didn't trigger a massive sell-off of GBP/USD. Indeed, a minor decline in the business activity of the industrial sector is not fatal for the domestic economy. The key to market sentiment today is how traders will respond to the US nonfarm payrolls. In case of strong employment in the US public and private sectors, the bulls will have to defend actively the nearest support at 1.3106. A false breakout at this level will generate a sell signal that is capable of returning GBP/USD to the middle of the sideways channel at 1.3142. A breakout and a test of this level downwards will create an extra entry point for long positions. This will reinforce buying pressure and open the door higher towards the upper border of the trading range that coincides with yesterday's high at 1.3179. I recommend setting take profit there. A more distant target is seen at 1.3219, though it would be hard to reach this level under the current market conditions.
This scenario will be possible in the second half of the day only on condition of poor US nonfarm payrolls. If GBP/USD declines during the American trading hours and the bulls lack activity at 1.3106, it would be better to cancel buying until a more important level at 1.3071. I would advise you to enter the market only during a false breakout. We could buy GBP/USD immediately at a drop off 1.3038 or lower from 1.3003, bearing in mind a 30-35-pips intraday correction.
What is needed to open short positions on GBP/USD
The bear market will be cemented on condition of upbeat US employment data. Notably, GBP buyers were trying to enter the market again for the whole trading week. They aimed to push the price up, proceeding with the bullish trend that began in mid-February. A plunge in GBP/USD would be a convincing argument from the bears, thus destroying the chance for regaining the bullish momentum. The longer the pair is locked inside a trading range, the higher is the chance for a further downward move that has been going on since March 23. For the time being, GBP/USD is trading along moving averages technically, thus indicating a flat market. The bulls and the bears are engaged in a fierce standoff.
The major task for the bears is to defend the level of 1.3142. A market entry with short positions will be in play on condition of a false breakout and strong US employment data. In this case, we expect GBP/USD to resume the bearish trend and decline towards 1.3106. This level is worth fighting for because a move beyond this level will activate stop losses of sellers. This will push GBP/USD down to lows at 1.3071 and 1.3038. A deeper target is seen at 1.3003 where I recommend profit taking. In case the currency pair grows in the American session and the sellers lack activity at 1.1342, it would be better to cancel short positions until yesterday's high at 1.3179. I would recommend opening short positions there also on condition of a false breakout. We could sell GBP/USD immediately at a bounce off 1.3219 and higher from 1.3253, bearing in mind a 30-35-pips intraday correction.
The COT report from March 22 logs a sharp increase in short positions and a minor growth in long ones. GBP came under selling pressure last week in light of hawkish remarks from several Fed policymakers. The sterling had been already hurt by economic headwinds in the Kingdom that had put a strain on British households. Experts warn about a further downturn due to inflationary risks that are hard to estimate now.
A variety of factors puts a lid on the UK economy such as soaring energy prices, the lingering hostilities in Ukraine, and sanctions imposed by the UK and its European allies. This week, traders were selling GBP because of the dovish tone of the Bank of England Governor. Sells-offs are likely to continue amid the lack of positive news. The bulls will clutch at straws pinning hopes on some progress in the peace talks between Russia and Ukraine.
According to the COT report from March 22, long non-commercial positions rose from 32,442 to 32,753 whereas short non-commercial positions jumped from 61,503 to 69,997. It increased the negative delta of non-commercial net positions from -29,061 to -37,244. GBP/USD closed last week higher at 1.3010 against 1.3169 a week ago.
Indicators' signals:
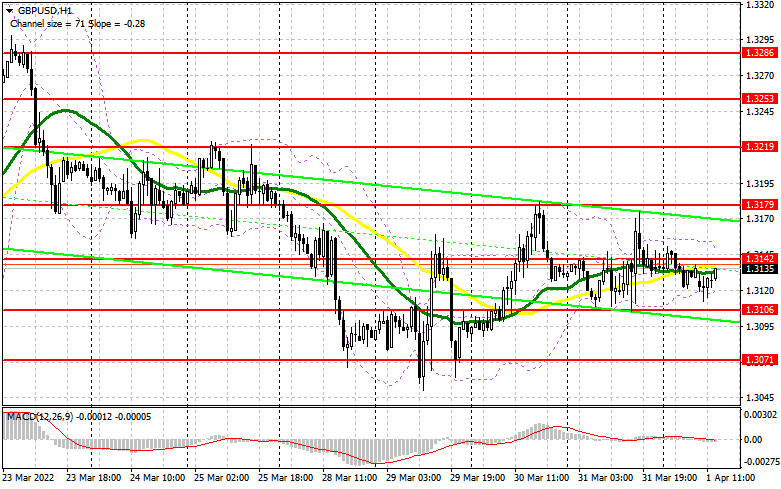
Trading is carried out roughly in the area of the 30 and 50 daily moving averages. It indicates that bullish and bearish pressure is in equilibrium.
Moving averages
Note: The period and prices of moving averages are considered by the author on the H1 hourly chart and differs from the general definition of the classic daily moving averages on the daily D1 chart.
Bollinger Bands
If GBP/USD declines, the indicators' lower at about 1.3120 will serve as support. Alternatively, if the currency pair grows, the upper border at 1.3155 will act as resistance.
Description of indicators
- Moving average (moving average, determines the current trend by smoothing out volatility and noise). Period 50. It is marked yellow on the chart.
- Moving average (moving average, determines the current trend by smoothing out volatility and noise). Period 30. It is marked green on the chart.
- MACD indicator (Moving Average Convergence/Divergence — convergence/divergence of moving averages) Quick EMA period 12. Slow EMA period to 26. SMA period 9
- Bollinger Bands (Bollinger Bands). Period 20
- Non-commercial speculative traders, such as individual traders, hedge funds, and large institutions that use the futures market for speculative purposes and meet certain requirements.
- Long non-commercial positions represent the total long open position of non-commercial traders.
- Short non-commercial positions represent the total short open position of non-commercial traders.
- Total non-commercial net position is the difference between short and long positions of non-commercial traders.


