empty
13.05.2022 06:31 AM
Forecast and trading signals for GBP/USD for May 13. COT report. Detailed analysis of the pair's movement and trade deals. The pound resisted a strong fall, but still updated its 2-year lows

GBP/USD 5M

This image is no longer relevant

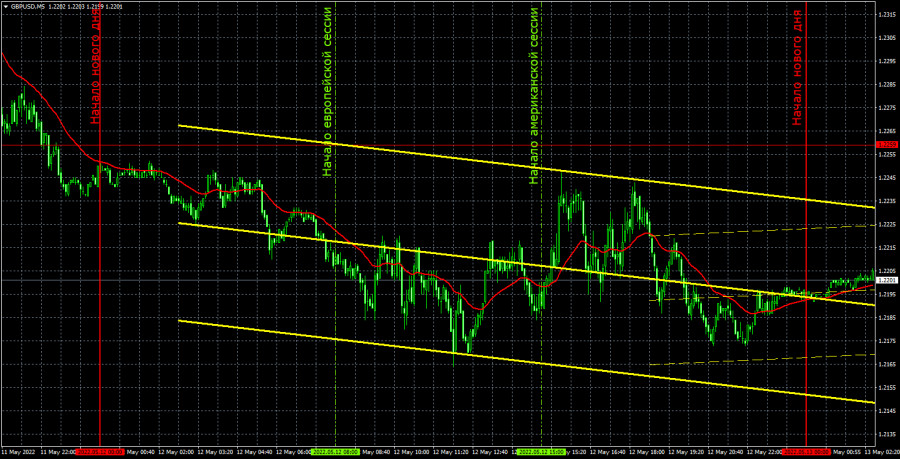
The GBP/USD currency pair was falling again on Thursday morning. It was not a very strong movement and the volatility of the fourth trading day of the week was twice as low for the pound than for the euro. Nevertheless, the British currency still renewed its 2-year lows, which means it continues to fall against the US currency. The UK published quite important reports on GDP and industrial production in the morning. The second is less important. Even one report on GDP, in principle, would be enough for the pound to continue to fall. However, the irony lies precisely in the fact that the pound fell mainly before the release, but not after. Thus, formally the market had the right to sell the pound yesterday and worked out the statistics from Great Britain, but in fact this is a very controversial statement. Most likely, the market again ignored the macroeconomic reports, as it has happened more than once in recent weeks. There is practically no geopolitical news from Ukraine now, only political ones. The foundation was missing on Thursday. Therefore, the question again arises, and on the basis of what the pound continues to fall???

No trading signals were formed on Thursday. Even the day before yesterday, the pair overcame the extreme level of 1.2259, since then it has not even approached any important level or line. The Ichimoku indicator lines are now much higher, and there are very few extreme levels at current price values, since the price was last here two years ago.

COT report:

This image is no longer relevant

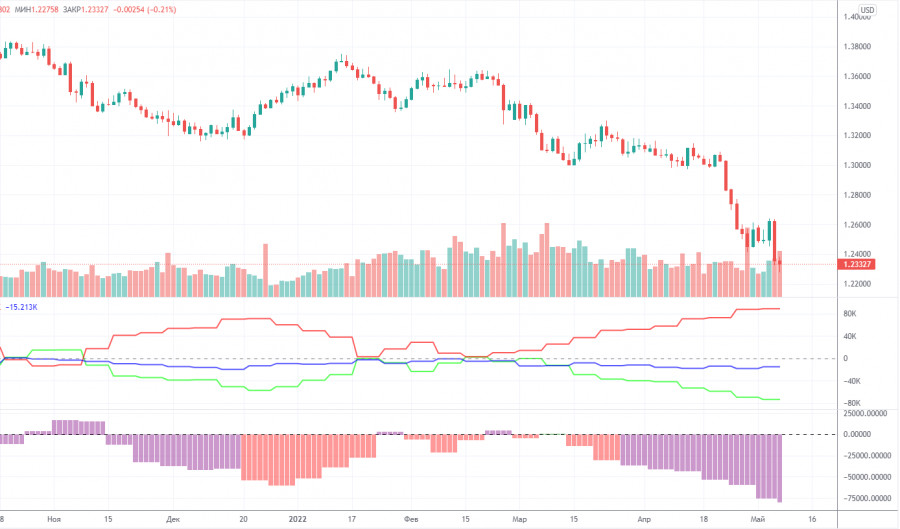
The latest Commitment of Traders (COT) report on the British pound has witnessed a new increase in bearish sentiment among professional traders. During the week, the non-commercial group closed 6,900 long positions and 2,700 short positions. Thus, the net position of non-commercial traders decreased by another 4,000. The net position has been falling for 2.5 months already, which is perfectly visualized by the green line of the first indicator in the chart above. The non-commercial group has already opened a total of 107,000 short positions and only 33,500 long positions. Thus, the difference between these numbers is threefold. This means that the mood among professional traders is now "pronounced bearish" and this is another factor that speaks in favor of the continuation of the fall of the British currency. Note that in the pound's case, the data from the COT reports very accurately reflects what is happening in the market. Traders are "strongly bearish" and the pound is also falling strongly against the US dollar. Assume the end of the downward trend, we do not see any reason. COT reports, foundation, geopolitics, macroeconomics, technique, all speak in favor of the fall of the pound and the rise of the dollar. Of course, the fall of the pound/dollar pair cannot continue forever, there must be at least upward corrections, but so far, there is not a single signal about the beginning of one.

We recommend to familiarize yourself with:

Overview of the EUR/USD pair. May 13. Finland and Sweden will apply for NATO membership within a week.

Overview of the GBP/USD pair. May 13. New absolutely groundless fall of the pound. Even despite the weak GDP.

Forecast and trading signals for GBP/USD on May 13. Detailed analysis of the movement of the pair and trading transactions.

GBP/USD 1H

This image is no longer relevant

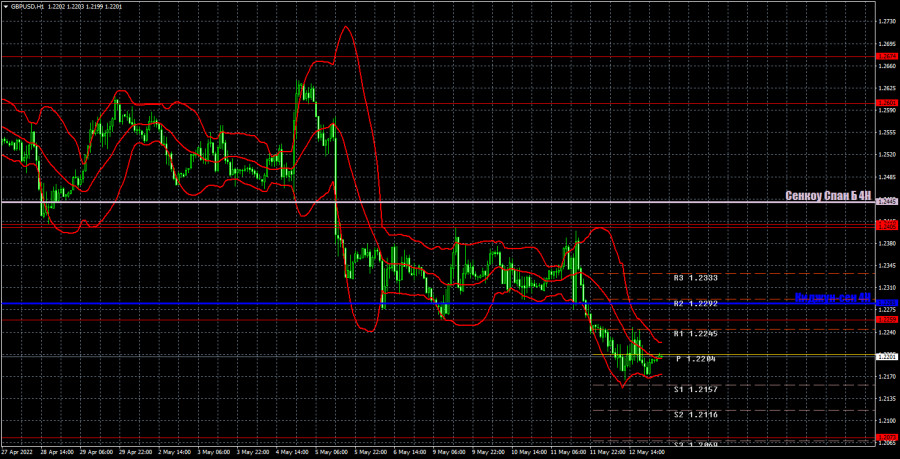
You can clearly see on the hourly timeframe that the pound has left the horizontal channel and resumed the downward trend. At this time, there is still no trend line or channel, as the movements remain rather jagged. However, this does not prevent the pound from regularly losing ground against the US currency. The British currency has not been able to properly correct against the last fall of 800 points. We highlight the following important levels on May 13: 1.2073, 1.2259, 1.2405-1.2410. Senkou Span B (1.2285) and Kijun-sen (1.2445) lines can also be sources of signals. Signals can be "rebounds" and "breakthrough" of these levels and lines. The Stop Loss level is recommended to be set to breakeven when the price passes in the right direction by 20 points. Ichimoku indicator lines can move during the day, which should be taken into account when determining trading signals. The chart also contains support and resistance levels that can be used to take profits on trades. Nothing particularly interesting in the UK or in the US on Friday. The University of Michigan Consumer Sentiment Index is unlikely to provoke a strong market reaction. However, given the mood of the market, we will not be at all surprised if the pound finds grounds for a new fall tomorrow. The nearest target is the 1.2073 level, the low of May 18, 2020.

Explanations for the chart:

Support and Resistance Levels are the levels that serve as targets when buying or selling the pair. You can place Take Profit near these levels.

Kijun-sen and Senkou Span B lines are lines of the Ichimoku indicator transferred to the hourly timeframe from the 4-hour one.

Support and resistance areas are areas from which the price has repeatedly rebounded off.

Yellow lines are trend lines, trend channels and any other technical patterns.

Indicator 1 on the COT charts is the size of the net position of each category of traders.

Indicator 2 on the COT charts is the size of the net position for the non-commercial group.

Seleccione el marco de tiempo
5
min
15
min
30
min
1
hora
4
horas
1
día
1
s.
Gana con los cambios en el valor de las criptomonedas con InstaForex.
Descarga MetaTrader 4 y abre tu primera operación.
  • Grand Choice
    Contest by
    InstaForex
    InstaForex always strives to help you
    fulfill your biggest dreams.
    UNIRSE AL CONCURSO

Recommended Stories

EUR/USD: plan para la sesión estadounidense del 7 de julio (análisis de las operaciones de la mañana) El euro sigue bajo presión

En mi pronóstico de la mañana presté atención al nivel de 1.1749 y planeé tomar decisiones de entrada al mercado desde ese punto. Veamos el gráfico de 5 minutos

Miroslaw Bawulski 13:01 2025-07-07 UTC+2

GBPUSD: plan para la sesión europea del 04 de julio. Informes Commitment of Traders COT (análisis de las operaciones de ayer). La presión sobre la libra se mantiene

Ayer se formaron varios puntos de entrada al mercado. Veamos el gráfico de 5 minutos y analicemos lo que ocurrió. En mi pronóstico matutino presté atención al nivel de 1.3659

Miroslaw Bawulski 07:40 2025-07-04 UTC+2

EURUSD: plan para la sesión europea del 04 de julio. Informes Commitment of Traders COT (análisis de las operaciones de ayer). El dólar se fortaleció tras los sólidos datos del mercado laboral

EURUSD: plan para la sesión europea del 04 de julio. Informes Commitment of Traders COT (análisis de las operaciones de ayer). El dólar se fortaleció tras los sólidos datos

Miroslaw Bawulski 07:40 2025-07-04 UTC+2

GBPUSD: plan para la sesión europea del 03 de julio. Informes Commitment of Traders COT (análisis de las operaciones de ayer). El par GBP/USD se desplomó ante problemas políticos

Ayer se formaron varios puntos de entrada al mercado. Veamos el gráfico de 5 minutos y analicemos lo que ocurrió allí. En mi pronóstico matutino, presté atención al nivel 1.3713

Miroslaw Bawulski 07:32 2025-07-03 UTC+2

EUR/USD: plan para la sesión europea del 03 de julio. Informes Commitment of Traders COT (análisis de las operaciones de ayer). El dólar volvió a caer tras el informe de ADP

EUR/USD: plan para la sesión europea del 03 de julio. Informes Commitment of Traders COT (análisis de las operaciones de ayer). El dólar volvió a caer tras el informe

Miroslaw Bawulski 07:32 2025-07-03 UTC+2

GBP/USD: plan para la sesión europea del 01 de julio. Informes Commitment of Traders COT (análisis de las operaciones de ayer). La libra fue objeto de una gran venta

Ayer se formaron varios puntos de entrada al mercado. Veamos el gráfico de 5 minutos y analicemos lo que ocurrió. En mi pronóstico matutino, presté atención al nivel 1.3766

Miroslaw Bawulski 07:55 2025-07-02 UTC+2

EUR/USD: plan para la sesión europea del 02 de julio. Informes Commitment of Traders COT (análisis de las operaciones de ayer). El euro retrocedió desde el máximo mensual

Ayer se formaron varios puntos de entrada al mercado. Veamos el gráfico de 5 minutos y analicemos lo que ocurrió. En mi pronóstico matutino, presté atención al nivel 1.1806

Miroslaw Bawulski 07:55 2025-07-02 UTC+2

GBP/USD: plan para la sesión europea del 01 de julio. Informes Commitment of Traders COT (análisis de las operaciones de ayer). La libra continúa su crecimiento

Ayer se formaron varios puntos de entrada al mercado. Veamos el gráfico de 5 minutos y analicemos lo que ocurrió. En mi pronóstico matutino presté atención al nivel 1.3723

Miroslaw Bawulski 07:05 2025-07-01 UTC+2

EUR/USD: plan para la sesión europea del 01 de julio. Informes Commitment of Traders COT (análisis de las operaciones de ayer). El euro cerró el mes en un nuevo máximo

EUR/USD: plan para la sesión europea del 01 de julio. Informes Commitment of Traders COT (análisis de las operaciones de ayer). El euro cerró el mes en un nuevo máximo

Miroslaw Bawulski 07:05 2025-07-01 UTC+2

GBP/USD: plan para la sesión europea del 30 de junio. Informes Commitment of Traders COT (análisis de las operaciones de ayer). La libra mantiene oportunidades de subir

El pasado viernes se formaron varios puntos de entrada al mercado. Veamos el gráfico de 5 minutos y analicemos lo que ocurrió. En mi pronóstico matutino, llamé la atención sobre

Miroslaw Bawulski 07:49 2025-06-30 UTC+2
¿No puede hablar ahora mismo?
Ingrese su pregunta en el chat.
Widget callback
 

Dear visitor,

Your IP address shows that you are currently located in the USA. If you are a resident of the United States, you are prohibited from using the services of InstaFintech Group including online trading, online transfers, deposit/withdrawal of funds, etc.

If you think you are seeing this message by mistake and your location is not the US, kindly proceed to the website. Otherwise, you must leave the website in order to comply with government restrictions.

Why does your IP address show your location as the USA?

  • - you are using a VPN provided by a hosting company based in the United States;
  • - your IP does not have proper WHOIS records;
  • - an error occurred in the WHOIS geolocation database.

Please confirm whether you are a US resident or not by clicking the relevant button below. If you choose the wrong option, being a US resident, you will not be able to open an account with InstaForex anyway.

We are sorry for any inconvenience caused by this message.