Earlier, I asked you to pay attention to the level of 1.1985 to decide when to enter the market. Let us take a look at the 5-minute chart to figure out the market situation. News about Boris Johnson's resignation boosted demand for the pound sterling, though only for a short period of time. As a result, the pair increased to 1.1985 and formed a false breakout, thus causing a sell signal. The pound sterling dropped by 30 pips. After that, demand for the currency resumed rising, allowing it to break 1.1985. The pair failed to show an opposite test of this level. That is why there were no signals to enter the market. For the second part of the day, the technical picture became different.
Conditions for opening long positions on GBP/USD:
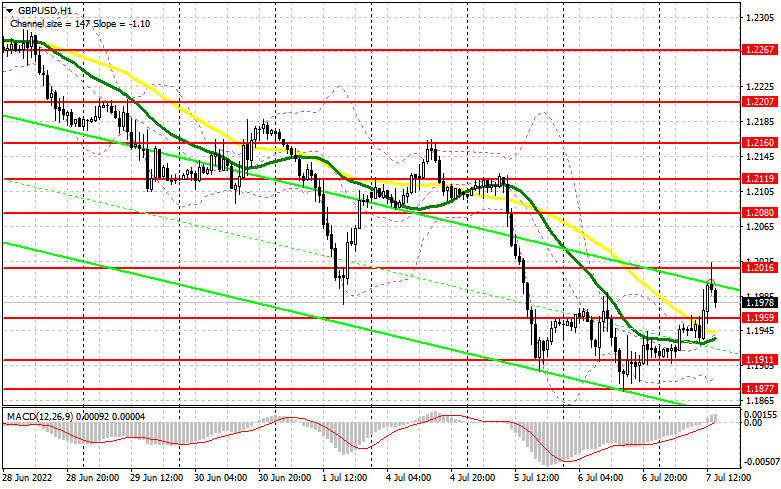
Strong data from the US is likely to exert pressure on the pound sterling, thus causing a decline in the second part of the day. The US is going to disclose reports on the ADP non-farm employment change and initial unemployment claims. If the pair drops, only a false breakout of the support level of 1.1959 will give a long signal with the target at 1.2016. The bearish movement will stop only if bulls gain control over 1.2016. A breakout and a downward test of this level will give a long signal with the target at 1.2080. A breakout of this level may lead to another long signal with the target at 1.2119, where it is recommended to lock in profits. If the pound/dollar pair continues falling and bulls fail to protect 1.1959, it will be better to avoid long positions. It will be better not to open buy orders until the price hits the support level of 1.1911. It will be possible to go long after a false breakout of this level. Traders may initiate buy orders from 1.1877 or lower – from 1.1816, expecting a rise of 30-35 pips.
Conditions for opening short positions on GBP/USD:
Bears are shocked by the recent news. However, the resignation of Boris Johnson will hardly support the pound sterling for a long time. Now, bears should protect a new resistance level of 1.2016, the test of which took place in the first part of the day. However, only strong data from the US may push the British pound lower.In the best-case scenario, traders should open shot positions after a false breakout of 1.2016, which may spur a decline to the low of 1.1959. Slightly below this level, there are bullish moving averages. That is why a breakout and an upward test of 1.1959 is very important. This will provide traders with a sell signal with the target at the low of 1.1911. The pair may slide to the support level of 1.1877. The next target is located at 1.1816, where it is recommended to lock in profits. If the pair advances during the US trade and sellers fail to protect 1.2016, bearish sentiment could become weaker. Traders may go short from the high of 1.2119 or higher – from 1.2160, expecting a decline of 30-35 pips.
COT report
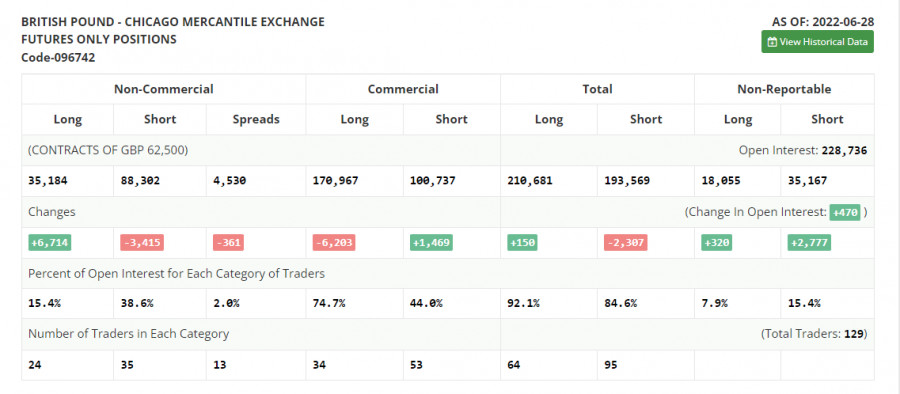
According to the COT report from June 28, the number of short positions declined, whereas the number of long positions jumped. This is pointing to an attempt to reach a new yearly low after the BoE's decision to increase the key interest rate and remain stuck to an aggressive monetary policy. A jump in inflation recorded in May is forcing the regulator to take aggressive measures. The cost of living crisis in the UK, which continues developing, is affecting the local economy especially during the period of the key interest rate hike. This fact is reducing the attractiveness of the British pound, which is actively declining to the low of 2020. The Fed's policy and the pace of the key interest rate hike are actively supporting the greenback. The COT report unveiled that the number of long non-commercial positions increased by 6,714 to 35,184, while the number of short non-commercial positions decreased by 3,415 to 88,302. However, this did not significantly affect the overall picture of the bear market, but led to a slight decrease in the negative value of the non-commercial net position from -63,247 to -53,118. The weekly closing price decreased to 1.2201 against 1.2295.
Signals of indicators:
Moving Averages
Trading is performed above the 30- and 50-day moving averages, which points to an attempt to form an upward correction.
Note: The period and prices of moving averages are considered by the author on the one-hour chart that differs from the general definition of the classic daily moving averages on the daily chart.
Bollinger Bands
In case of a rise, the support level will be located at the lower limit of the indicator of 1.1900.
Description of indicators
- Moving average (moving average, determines the current trend by smoothing volatility and noise). The period is 50. It is marked in yellow on the chart.
- Moving average (moving average, determines the current trend by smoothing volatility and noise). The period is 30. It is marked in green on the graph.
- MACD indicator (Moving Average Convergence/Divergence - convergence/divergence of moving averages). A fast EMA period is 12. A slow EMA period is 26. The SMA period is 9.
- Bollinger Bands. The period is 20.
- Non-profit speculative traders are individual traders, hedge funds, and large institutions that use the futures market for speculative purposes and meet certain requirements.
- Long non-commercial positions is a total number of long positions opened by non-commercial traders.
- Short non-commercial positions is a total number of short positions opened by non-commercial traders.
- The total non-commercial net position is a difference in the number of short and long positions opened by non-commercial traders.


