Analysis of Friday's deals:
30M chart of the EUR/USD pair
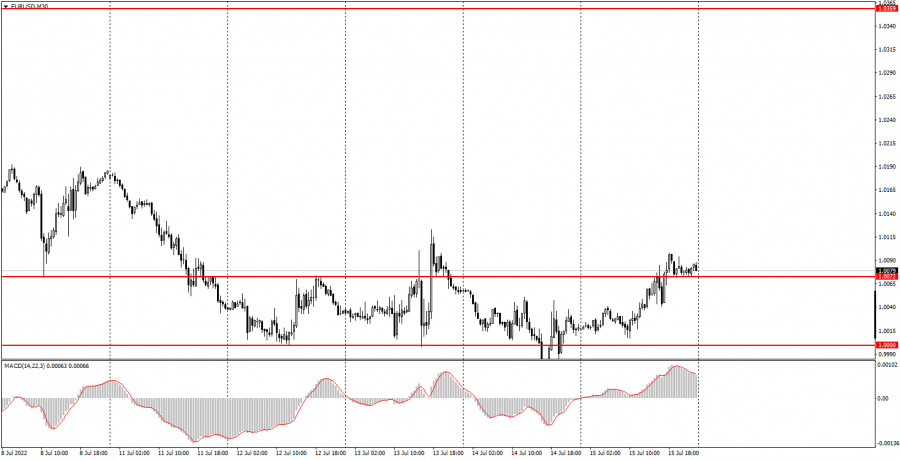
The EUR/USD currency pair tried to start a new round of corrective movement on Friday. The pair retreated from its 20-year lows with great difficulty, and in general, it cannot yet be said that the correction will be strong and long-lasting. We would even say the opposite: traders still continue to show their complete disinterest in buying the euro. The logic here is simple: the stronger the fall, the stronger the rebound should be later when traders start taking profits. At the same time, we do not observe any "strong rebound" at all, but the fall in recent months and even years has been very strong. Thus, it is likely that we will see another indistinct correction, after which the fall will resume. There is not much to say about the statistics released on Friday. If retail sales in the US showed the best dynamics in June, then industrial production declined with positive forecasts. That is, the reports were not the most significant, and even overlapped each other. Therefore, we do not connect the pair's movement on Friday with macroeconomic statistics at all.
5M chart of the EUR/USD pair
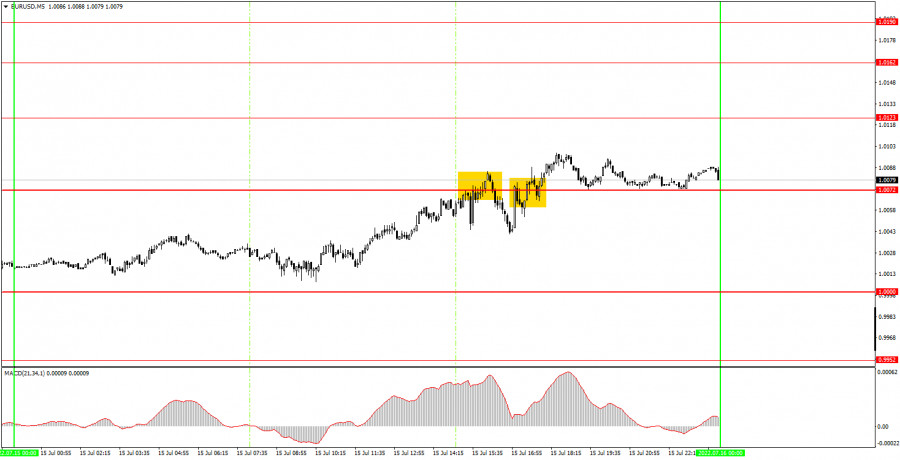
Friday's trading signals on the 5-minute timeframe were as vague as the movement itself. Despite the fact that the volatility was at least 90 points, we cannot call this movement good. Two trading signals of the day formed near the level of 1.0072, but if desired, more signals could be considered there, since the price mostly ignored this level. We left it in the chart for now so that there is no empty space, but there is a high probability that it will have to be removed. The first bounce signal from 1.0072 was very inaccurate. In fact, the pair bounced twice from this level in a short period of time. And down after the formation of the signal, it managed to reach only 20 points. And even then, after the second rebound, and after the first - not at all. That is, novice traders could have problems with the first signal. The circumstance is softened a bit by the fact that the moment when this signal was formed was when the report on retail sales was released in America and the market reaction to 23 points nevertheless followed. That is, it turns out that there was a reaction, but it was insignificant and at the same time spoiled a good signal. The second signal to overcome the level of 1.0072 was also not the most accurate. But the price still settled above this level and was able to go up 16 points, which was at least enough to set Stop Loss to breakeven. Therefore, it was definitely not possible to make money on Friday, but at least there were no serious losses.
How to trade on Monday:
The new downward trend continues on the 30-minute time frame, and the price with grief in half settled above the level of 1.0072. Theoretically, the euro received certain technical grounds for continuing growth, but in fact it can resume falling at any moment. On the 5-minute TF on Monday, it is recommended to trade at the levels of 1.0000, 0.9952, 1.0000, 1.0072, 1.0123, 1.0162-1.0190, 1.0235. When passing 15 points in the right direction, you should set Stop Loss to breakeven. There will be no important report or event in either the European Union or the United States. However, this does not mean that now the pair will stand still. The last two days also showed that the upward correction is still a big problem for the pair, but the volatility remains very high for the euro.
Basic rules of the trading system:
1) The signal strength is calculated by the time it took to form the signal (bounce or overcome the level). The less time it took, the stronger the signal.
2) If two or more deals were opened near a certain level based on false signals (which did not trigger Take Profit or the nearest target level), then all subsequent signals from this level should be ignored.
3) In a flat, any pair can form a lot of false signals or not form them at all. But in any case, at the first signs of a flat, it is better to stop trading.
4) Trade deals are opened in the time period between the beginning of the European session and until the middle of the US one, when all deals must be closed manually.
5) On the 30-minute TF, using signals from the MACD indicator, you can trade only if there is good volatility and a trend, which is confirmed by a trend line or a trend channel.
6) If two levels are located too close to each other (from 5 to 15 points), then they should be considered as an area of support or resistance.
On the chart:
Support and Resistance Levels are the Levels that serve as targets when buying or selling the pair. You can place Take Profit near these levels.
Red lines are the channels or trend lines that display the current trend and show in which direction it is better to trade now.
The MACD indicator (14,22,3) consists of a histogram and a signal line. When they cross, this is a signal to enter the market. It is recommended to use this indicator in combination with trend lines (channels and trend lines).
Important speeches and reports (always contained in the news calendar) can greatly influence the movement of a currency pair. Therefore, during their exit, it is recommended to trade as carefully as possible or exit the market in order to avoid a sharp price reversal against the previous movement.
Beginners on Forex should remember that not every single trade has to be profitable. The development of a clear strategy and money management are the key to success in trading over a long period of time.


