Details of the economic calendar for September 23
Last week ended with the publication of preliminary data on business activity indices in Europe, the United Kingdom and the United States. The indices came out badly, except for the US.
Eurozone manufacturing PMI fell from 49.6 to 48.5 points, while services PMI fell from 49.8 to 48.9 points.
UK manufacturing PMI rose from 47.3 to 48.5 points, while services PMI recorded a decline from 50.9 to 49.2 points. The composite index fell from 49.6 to 48.4 points.
In the United States, the picture is reversed, with the manufacturing PMI up from 51.5 to 51.8. Services PMI rose from 43.7 to 49.2 points.
The publication of an anti-crisis plan to rescue the UK economy was considered the key event on Friday. The largest tax cut in 50 years, the removal of the 45% surcharge for the highest paid workers, and a sharp reduction in taxes on dividends are expected. Not only that, but the plan includes a long-term freeze on household electricity rates, which experts estimate will cost around £60bn over the six months starting in October.
All these actions are reminiscent of all-in tactics, where huge borrowings will be needed to cover the budget deficit.
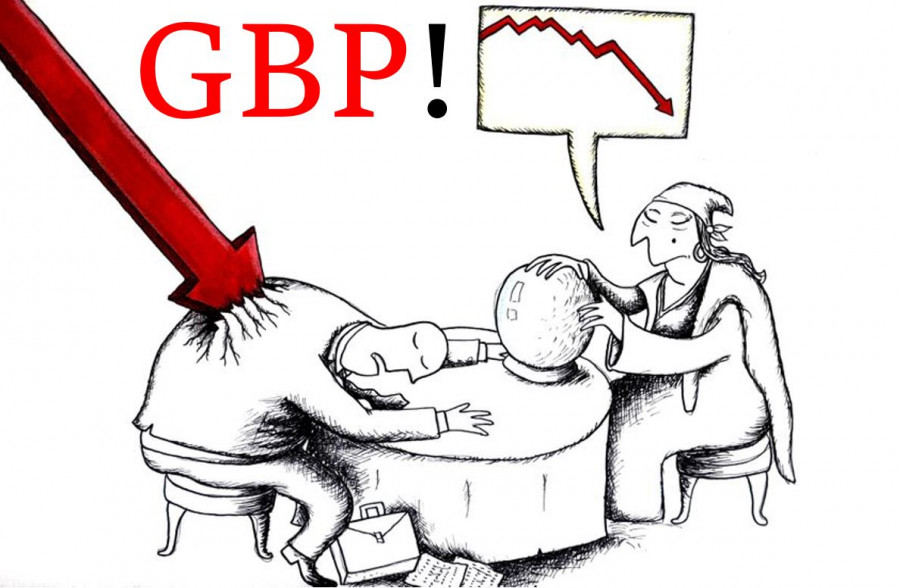
This news brought down the value of the British currency by about 8% against the US dollar. Simultaneously with the fall of the pound sterling, the British stock market also collapsed.
This pivotal decision has raised doubts in economic and political circles about the future sustainability of the UK economy and concerns about whether the UK's new economic approach is sustainable.
Media
"The UK is behaving a bit like an emerging market turning itself into a submerging market," former U.S. Treasury Secretary Larry Summers told Bloomberg TV. "Britain will be remembered for having pursued the worst macroeconomic policies of any major country in a long time."
Analysis of trading charts from September 23
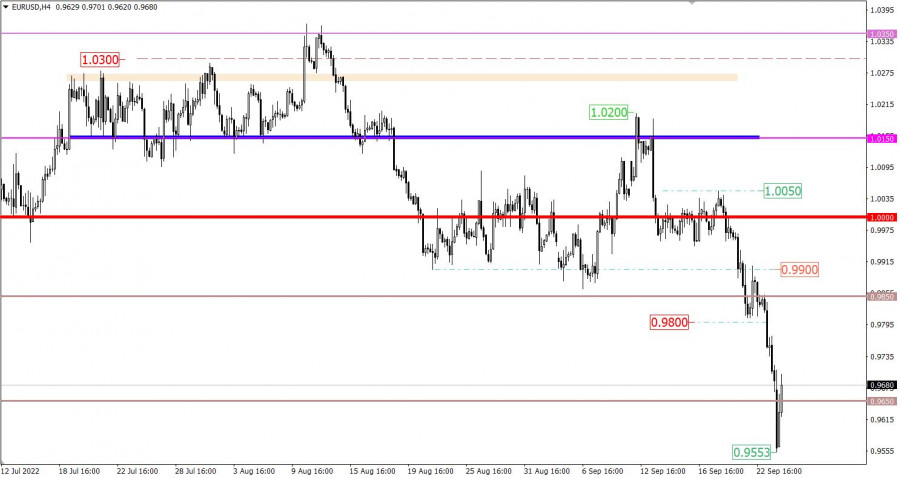
Since Friday, the euro has lost more than 250 points in value against the US dollar. As a result, the quote peaked at 0.9553, last seen in June 2002.
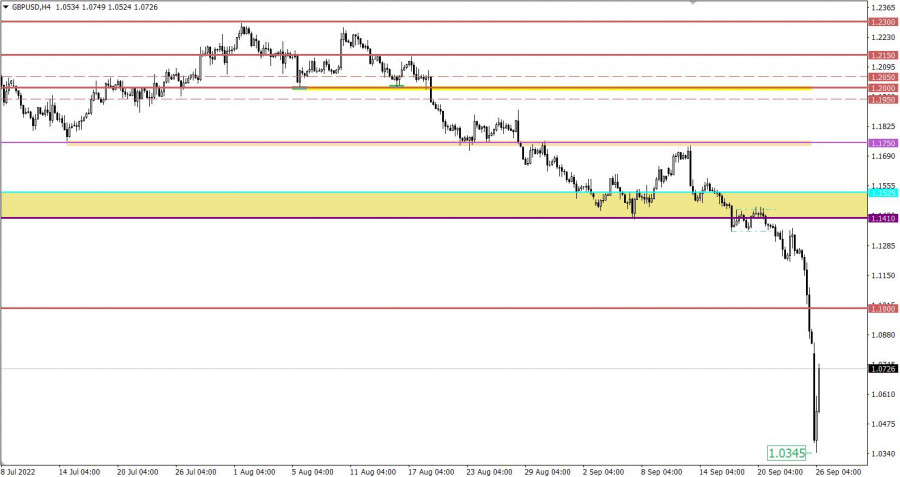
The GBPUSD currency pair did not just collapse by almost 1,000 points (about 8.5%), the quote also broke through all possible levels and updated the lows. History has never seen such low price values.
The cause and effect of the fall is described above.
Economic calendar for September 26
Today, the macroeconomic calendar is empty, the publication of important statistical data is not expected. It is worth noting that the tense information background persists, and market participants will focus on it.
Trading plan for EUR/USD on September 26
At the moment, the formation of a technical pullback is observed on the trading chart, which, under current circumstances, is considered justified in the market due to overheating of short positions in the euro. It is worth noting that the speculative mood prevails in the market, which sets in motion an inertial course. Thus, it is impossible to exclude from the possible scenario the subsequent depreciation of the euro after the pullback, where technical signals will be ignored.
Trading plan for GBP/USD on September 26
The minimum price value that has arisen since the opening of a new trading week is 1.0345. There was a technical pullback relative to it, approximately by 3.8% (400 points), which, like the euro, is justified on the market due to the catastrophic overheating of short positions in the pound sterling. In this situation, despite the historical values, the market retains a high interest in the downward cycle. Speculators, on the occasion of inertia, can still continue to decline, ignoring technical signals. In this case, we can see the price approaching parity—1.0000.
The situation could improve if the BoE postpones planned bond sales and the Treasury is forced to announce a medium-term fiscal consolidation plan to restore market confidence.
In this case, the pullback may turn into a full-scale correction, restoring the exchange rate of the British currency.
What is shown in the trading charts?
A candlestick chart view is graphical rectangles of white and black light, with sticks on top and bottom. When analyzing each candle in detail, you will see its characteristics of a relative period: the opening price, closing price, and maximum and minimum prices.
Horizontal levels are price coordinates, relative to which a stop or a price reversal may occur. These levels are called support and resistance in the market.
Circles and rectangles are highlighted examples where the price of the story unfolded. This color selection indicates horizontal lines that may put pressure on the quote in the future.
The up/down arrows are the reference points of the possible price direction in the future.


