empty
 
 
19.10.2022 10:08 AM
Trading plan for EURUSD and GBPUSD for beginner traders on October 19, 2022

Overview of macro events for October 18

Industrial production growth in the United States accelerated to 5.33% from 3.9%, beating market expectations of 3.4%. In light of the strong results, the pound sterling and the euro showed a modest rise in value, while demand for the greenback increased among traders.

Analysis of trading charts for October 18

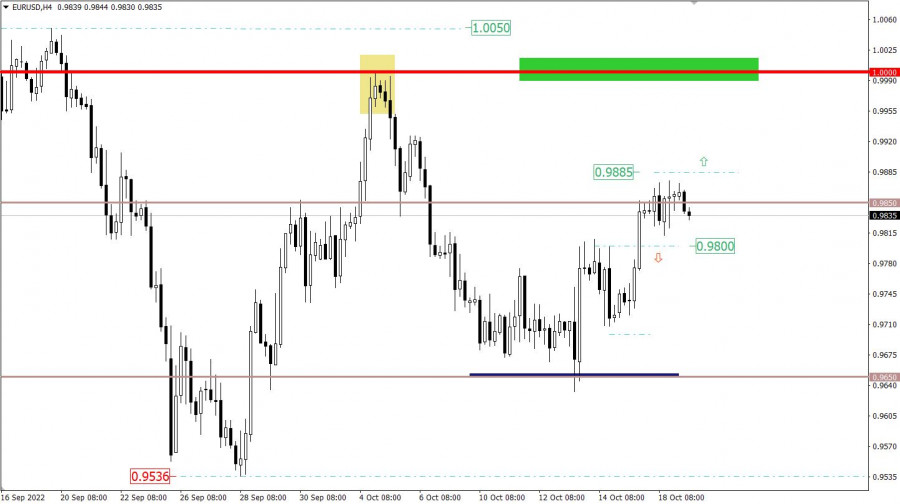
The number of long positions on EUR/USD decreased within the key level of 0.9850. Consequently, a slowdown in the uptrend led to a standstill/pullback.

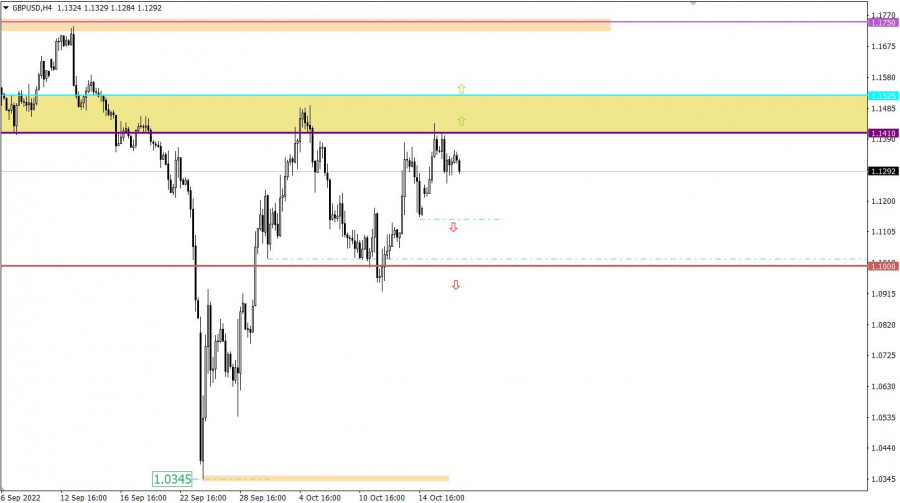
During the course of the recent uptrend, GBP/USD approached 1.1410/1.1525 resistance. The price reached the barrier thrice. As a result, the trend slowed and a pullback occurred.

This image is no longer relevant

Macro events on October 19

Today, the United Kingdom saw the release of its inflation data during the European session. Consumer prices in the country rose to 10.1%.

In light of an increase in inflation, the Bank of England is likely to remain hawkish.

A similar report is due today in the eurozone. Should the final results not come in line with the preliminary estimates, this would trigger market jitters. In fact, the market is ready for a new rise in the reading as it has already priced in the flash data.

Trading plan for EUR/USD on October 19

Under current circumstances, it would be wiser to focus on the limits of the sideways channel, seen at 0.9810 and 0.9875. This range is passing exactly along the key level of 0.9850, which could indicate the accumulation process.

Consider buying the instrument after consolidation above 0.9885.

Short poisons could be opened after the price settles below 0.9800.

This image is no longer relevant

Trading plan for GBP/USD on October 19

There has been no signal to buy the pair so far, as the bulls are still feeling the pressure that comes from resistance. In order to extend the uptrend, the quote should settle above the 1.1410 mark. This would signal the possibility of a breakout through resistance. Consolidation above 1.1525 would confirm a breakout. Until then, the price may pull back.

This image is no longer relevant

Indicators on charts

A candlestick chart shows white and black bars with lines at the top and bottom. When analyzed in detail, each candlestick is different depending on a time frame: the opening and closing price as well as the maximum and minimum price.

Horizontal levels are levels of support and resistance that help traders determine when a trend is likely to change.

Circles and rectangles are highlighted examples where past reversals occurred. Such highlighting indicates horizontal lines that may exert some pressure on quotes in the future.

Up/down arrows show possible future price movements.

Gana con los cambios en el valor de las criptomonedas con InstaForex.
Descarga MetaTrader 4 y abre tu primera operación.
  • Grand Choice
    Contest by
    InstaForex
    InstaForex always strives to help you
    fulfill your biggest dreams.
    UNIRSE AL CONCURSO
  • Depósito al azar
    ¡Haga un depósito en su cuenta de $3,000 y obtenga $5000 más!
    ¡En Noviembre, sorteamos $5000 dentro de la campaña Depósito afortunado!
    Obtenga la oportunidad de ganar depositando $3,000 en una cuenta de operaciones. Tras haber cumplido esta condición, se convertirá en un participante de la campaña.
    UNIRSE AL CONCURSO
  • Opere de forma inteligente, gane un dispositivo
    Recargue su cuenta con al menos $500, regístrese en el concurso y tenga la oportunidad de ganar dispositivos móviles.
    UNIRSE AL CONCURSO
  • 100% de bonificación
    Su oportunidad única de obtener un bono del 100 % en su depósito
    OBTENER BONO
  • 55% de bonificación
    Solicite un bono del 55% en cada depósito
    OBTENER BONO
  • 30% de bonificación
    Reciba un bono del 30% cada vez que recargue su cuenta
    OBTENER BONO

Recommended Stories

¿No puede hablar ahora mismo?
Ingrese su pregunta en el chat.
Widget callback