empty
21.12.2022 11:27 AM
EUR/USD, GBP/USD: trading plan for beginners on December 21, 2022

Macroeconomic calendar on December 20

Tuesday's macroeconomic calendar was not much different from Monday's one. It was bereft of any important releases from Europe and the UK. Meanwhile, the United States published data on the housing market, which reflected big problems in this sector of the economy.

US building permits fell by 11.2% in November, notching the biggest decline since the beginning of the year. At the same time, housing starts decreased by 0.5% in November.

As a result, the US dollar slowed down its upward cycle.

Overview of trading charts on December 20

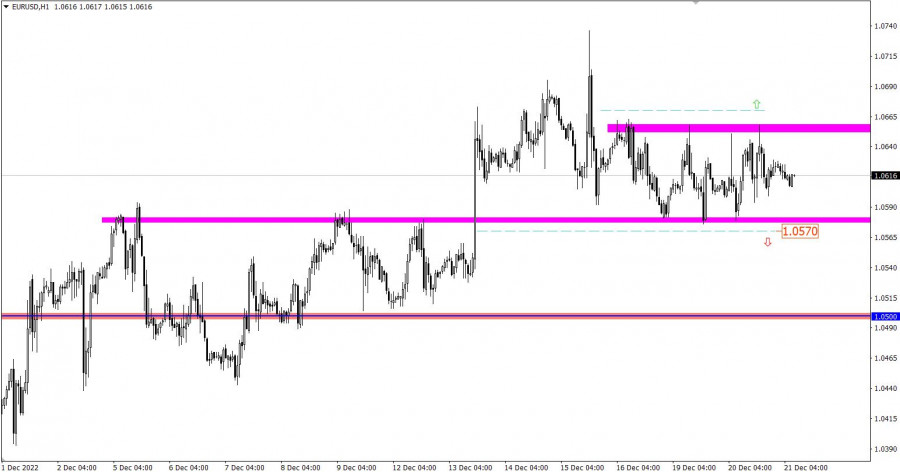
The EUR/USD pair has been moving within the sideways range of 1.0580/1.0660 for the third consecutive day, which indicates an accumulation process. Most likely, the current stagnation will trigger fresh momentum in the market.

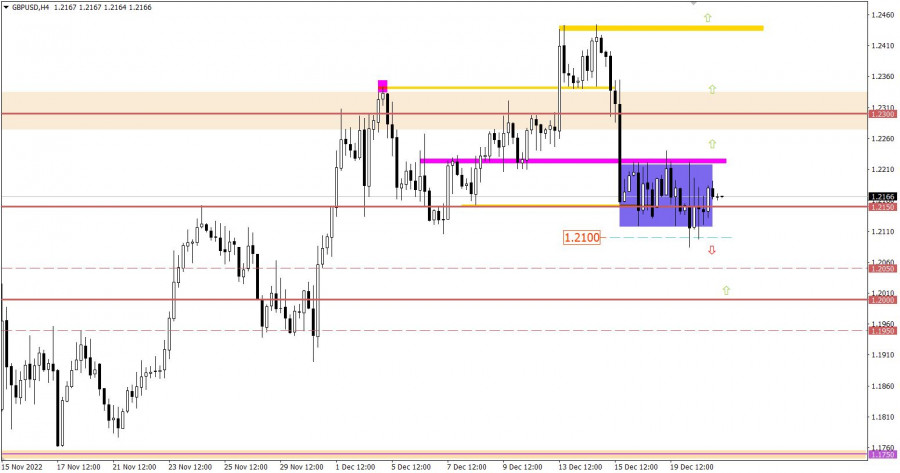
Meanwhile, the GBP/USD pair is also trading sideways around the level of 1.2150. Notably, there are many Doji candles on the four-hour chart, which indicates clear uncertainty over its further movement among market participants. At the same time, this movement can be classified as an accumulation process, which may force the price to gain strong momentum and get out of the range.

This image is no longer relevant

Macroeconomic calendar on December 21

For the third day in a row, the macroeconomic calendar has been almost bereft of any important releases.

The only thing traders may take notice of is US existing home sales, which are forecast to have declined in November.

Time targeting

US Existing Home Sales (Nov)

EUR/USD trading plan for December 21

Based on the successive cycles in the given range, it can be assumed that the price may gain momentum and get out of the range. The best tactic is to trade with a view to breaking through one or another range boundary, waiting for confirmation on the four-hour chart.

Conclusion:

A bullish scenario will be considered by traders if the price consolidates above 1.0670 on the four-hour chart. In this case, the volume of long positions will increase, and the price may rise above the local high of the upward cycle.

A bearish scenario will be relevant if the price fixes below 1.0570 on the four-hour chart. In this case, the price is expected to return to the area of 1.0500.

This image is no longer relevant

GBP/USD trading plan for December 21

The sideways range is limited by the levels of 1.2100 and 1.2230. To get out of the range, the quote needs to break through one or another range boundary on the four-hour chart. In this case, there will be an increase in the volume of trading positions in the direction of a breakout.

Conclusion:

A bullish scenario will be considered by traders if the price consolidates above 1.2230 on the four-hour chart. This move will lead to an increase in the volume of long positions, and the pair will head towards 1.2300-1.2350.

A bearish scenario will be relevant if the price fixes below 1.2100 on the four-hour chart. In this case, the price is expected to return to the psychological level of 1.2000.

This image is no longer relevant

What's on trading charts

The candlestick chart shows graphical white and black rectangles with lines from above and below. While conducting a detailed analysis of each individual candlestick, one can notice its features intrinsic to a particular time frame: the opening price, the closing price, as well as the highest and lowest prices.

Horizontal levels are price levels, at which the price may stop or reverse. They are called support and resistance levels.

Circles and rectangles are highlighted examples where the price reversed in the course of its history. This color highlighting indicates horizontal lines, which can exert pressure on the quote in the future.

Up/down arrows signal a possible future price direction.

Traders are recommended to read the following article:

EUR/USD and GBP/USD: trading plan for beginners on December 20

Seleccione el marco de tiempo
5
min
15
min
30
min
1
hora
4
horas
1
día
1
s.
Gana con los cambios en el valor de las criptomonedas con InstaForex.
Descarga MetaTrader 4 y abre tu primera operación.
  • Grand Choice
    Contest by
    InstaForex
    InstaForex always strives to help you
    fulfill your biggest dreams.
    UNIRSE AL CONCURSO

Recommended Stories

GBP/USD: plan para la sesión europea del 20 de marzo. Informes COT Commitment of Traders (análisis de las operaciones de ayer). La libra sigue subiendo con seguridad

Ayer se formaron varios puntos de entrada en el mercado. Echemos un vistazo al gráfico de 5 minutos y veamos qué ocurrió allí. En mi pronóstico de la mañana presté

Miroslaw Bawulski 07:57 2025-03-20 UTC+2

EUR/USD: plan para la sesión europea del 20 de marzo. Informes COT Commitment of Traders (análisis de las operaciones de ayer). Powell no ayudó mucho al dólar

Ayer se formaron varios puntos de entrada en el mercado. Echemos un vistazo al gráfico de 5 minutos y veamos qué ocurrió allí. En mi previsión de la mañana, presté

Miroslaw Bawulski 07:57 2025-03-20 UTC+2

GBP/USD: plan para la sesión europea del 19 de marzo. Informes COT Commitment of Traders (análisis de las operaciones de ayer). La libra se sitúa en 1,3000

Ayer se formaron varios puntos de entrada en el mercado. Echemos un vistazo al gráfico de 5 minutos y veamos qué sucedió allí. En mi pronóstico de la mañana presté

Miroslaw Bawulski 07:39 2025-03-19 UTC+2

EUR/USD: plan para la sesión europea del 19 de marzo. Informes COT Commitment of Traders (análisis de las operaciones de ayer). El euro se compra cada vez que hay una buena caída

EUR/USD: plan para la sesión europea del 19 de marzo. Informes COT Commitment of Traders (análisis de las operaciones de ayer). El euro se compra cada

Miroslaw Bawulski 07:39 2025-03-19 UTC+2

GBP/USD: plan para la sesión europea del 18 de marzo. Informes COT Commitment of Traders (análisis de las operaciones de ayer). La libra actualiza otro máximo mensual

Ayer sólo se formó un punto de entrada. Echemos un vistazo al gráfico de 5 minutos y veamos qué ocurrió. En mi pronóstico de la mañana, presté atención al nivel

Miroslaw Bawulski 07:21 2025-03-18 UTC+2

EUR/USD: plan para la sesión europea del 18 de marzo. Informes COT Commitment of Traders (análisis de las operaciones de ayer). El euro sigue posicionándose para una nueva subida

Ayer sólo se formó un punto de entrada adecuado. Propongo echar un vistazo al gráfico de 5 minutos y entender lo que ocurrió. En mi pronóstico de la mañana presté

Miroslaw Bawulski 07:21 2025-03-18 UTC+2

GBP/USD: plan para la sesión europea del 17 de marzo. Informes COT Commitment of Traders (análisis de las operaciones de ayer). La libra se obstina en no querer caer

El viernes pasado se formaron varios puntos de entrada en el mercado. Echemos un vistazo al gráfico de 5 minutos y veamos qué sucedió allí. En mi pronóstico

Miroslaw Bawulski 07:31 2025-03-17 UTC+2

EUR/USD: plan para la sesión europea del 17 de marzo. Informes COT Commitment of Traders (análisis de las operaciones de ayer). El euro está encerrado en un canal lateral

El viernes pasado sólo se formó un punto de entrada. Echemos un vistazo al gráfico de 5 minutos y entendamos lo que ocurrió allí. En mi pronóstico de la mañana

Miroslaw Bawulski 07:31 2025-03-17 UTC+2

GBP/USD: plan para la sesión europea del 14 de marzo. Informes COT del Commitment of Traders (análisis de las operaciones de ayer). La libra mantiene sus posibilidades de subir

Ayer se formaron varios puntos de entrada en el mercado. Echemos un vistazo al gráfico de 5 minutos y veamos qué sucedió allí. En mi pronóstico de la mañana presté

Miroslaw Bawulski 07:34 2025-03-14 UTC+2

EUR/USD: plan para la sesión europea del 14 de marzo. Informes COT del Commitment of Traders (análisis de las operaciones de ayer). El euro sigue corrigiéndose

Ayer se formaron varios puntos de entrada en el mercado. Echemos un vistazo al gráfico de 5 minutos y veamos qué sucedió allí. En mi pronóstico de la mañana presté

Miroslaw Bawulski 07:34 2025-03-14 UTC+2
¿No puede hablar ahora mismo?
Ingrese su pregunta en el chat.
Widget callback
 

Dear visitor,

Your IP address shows that you are currently located in the USA. If you are a resident of the United States, you are prohibited from using the services of InstaFintech Group including online trading, online transfers, deposit/withdrawal of funds, etc.

If you think you are seeing this message by mistake and your location is not the US, kindly proceed to the website. Otherwise, you must leave the website in order to comply with government restrictions.

Why does your IP address show your location as the USA?

  • - you are using a VPN provided by a hosting company based in the United States;
  • - your IP does not have proper WHOIS records;
  • - an error occurred in the WHOIS geolocation database.

Please confirm whether you are a US resident or not by clicking the relevant button below. If you choose the wrong option, being a US resident, you will not be able to open an account with InstaForex anyway.

We are sorry for any inconvenience caused by this message.