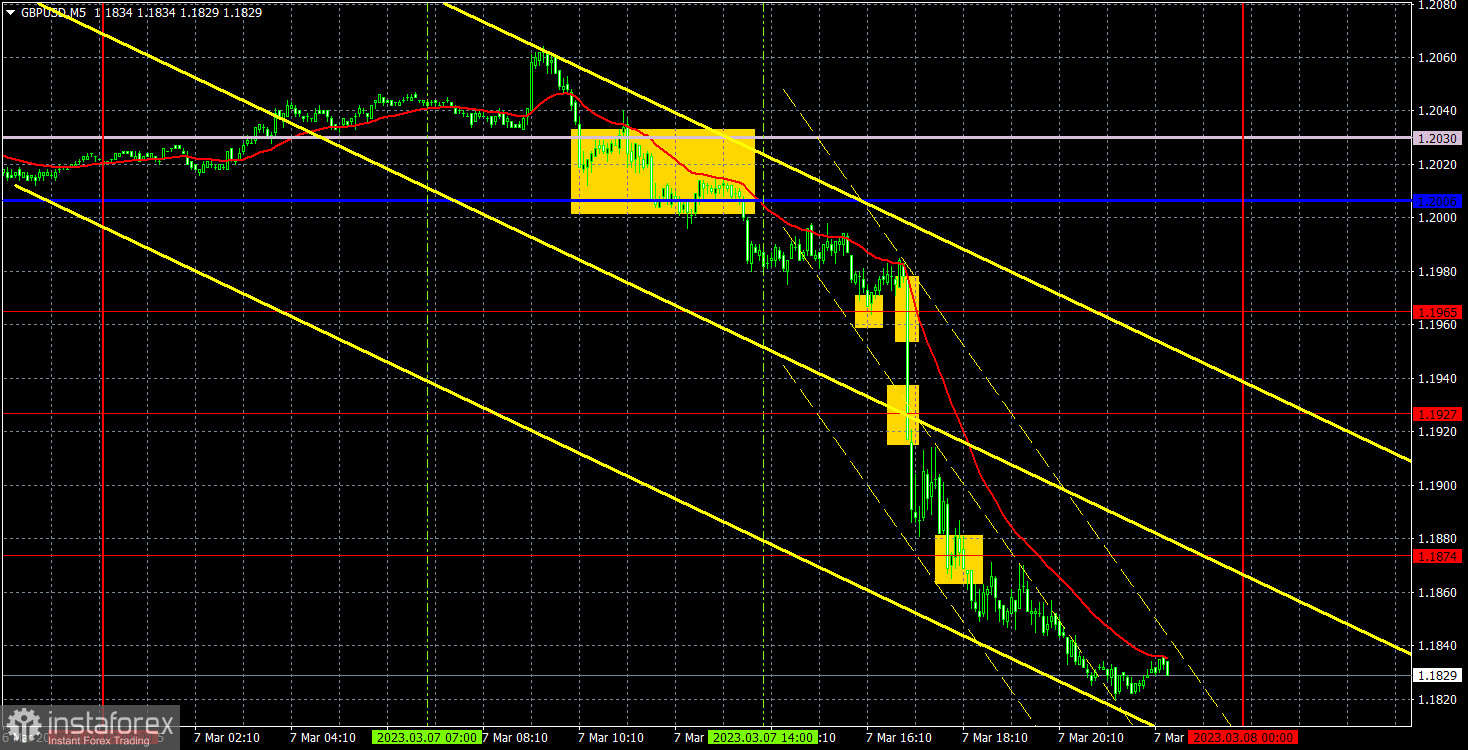
Analysis of GBP/USD 5M.
The GBP/USD pair had a similar dynamic to the EUR/USD pair on Tuesday. It is hardly surprising given that the economic calendar included only one important event for both currencies. However, there was one slight difference. The pound sterling escaped the sideways channel where it has been moving in the last three weeks. The euro, on the contrary, is stuck in the wide range. Yesterday, we saw trend movements triggered by market reaction to Jerome Powell's speech. Today, trading is likely to be more sluggish despite Powell's second speech at Congress. Hence, the US currency is expected to grow across the board. An upward correction may occur this week, especially if NFP data will be disappointing. In the medium term, the downward momentum is likely to persist.
Trading signals and movements were pretty clear yesterday but one moment ruined everything. Investors could open short positions after the breakout of the lines of the Ichimoku indicator. The pair dropped to 1.1965 and rebounded from it. It happened half an hour before the start of Jerome Powell's speech. There were two options: to close short positions with a small profit and leave the market or keep short positions with a buy signal and set a Stop Loss order. It was not the most obvious decision but Powell's speech could cause a strong movement. Besides, the profit from short positions was not so big. Hence, it would be appropriate to take a risk. Moreover, a Stop Loss order was placed. However, traders could act differently at that moment. Tuesday's profit depended on which decision they would make.
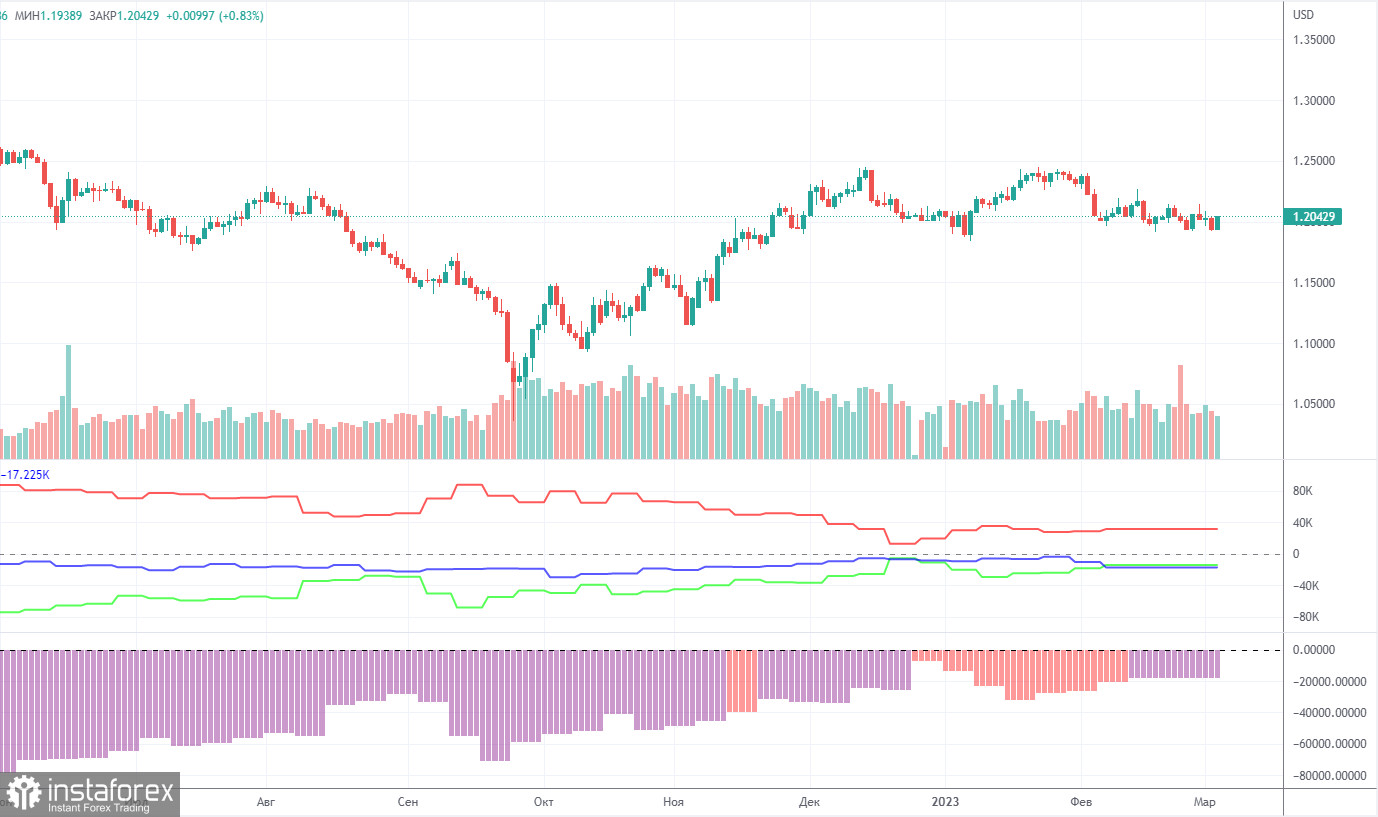
COT report:
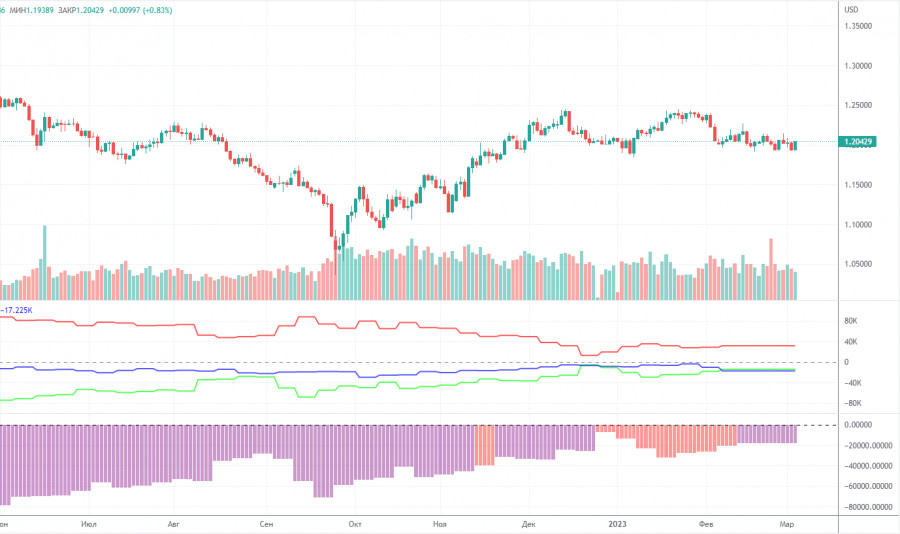
There have been no COT reports for about a month. The last report shows the trajectory of the pound sterling on February 7. Naturally, these reports are no longer relevant but they give at least some clues about the overall sentiment. During the last reporting week, the Non-commercial group of traders opened 10,900 long positions and 6,700 short ones. Thus, the net position of non-commercial traders increased by another 4,200. The net position has been steadily growing over the past months but the sentiment of big traders still remains bearish. Although the pound sterling is rising against the US dollar in the medium term, there are no fundamental drivers for its rally. Therefore, there is a likelihood of a sharp drop in the near future. Technically, it has already begun but it looks like a flat. The euro and the pound sterling have a similar dynamic now. However, the net position for the euro is positive and signals the completion of the upward momentum. For the pound sterling, the net position is negative. The Non-commercial group of traders has opened a total of 61,000 short positions and 47,000 long ones. The difference is quite noticeable. This is why I am skeptical about the long-term upward movement of the British currency and expect it to fall more drastically.
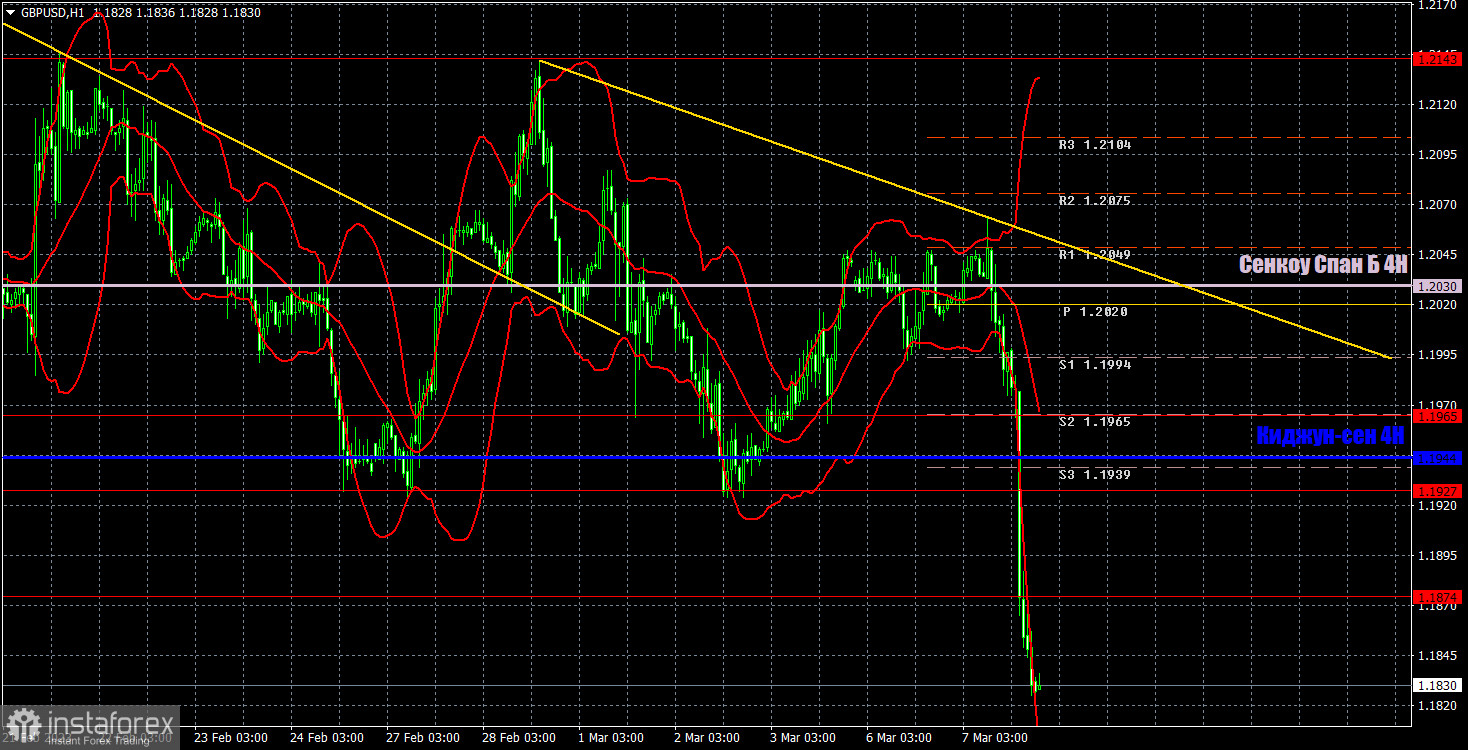
Analysis of GBP/USD 1H.
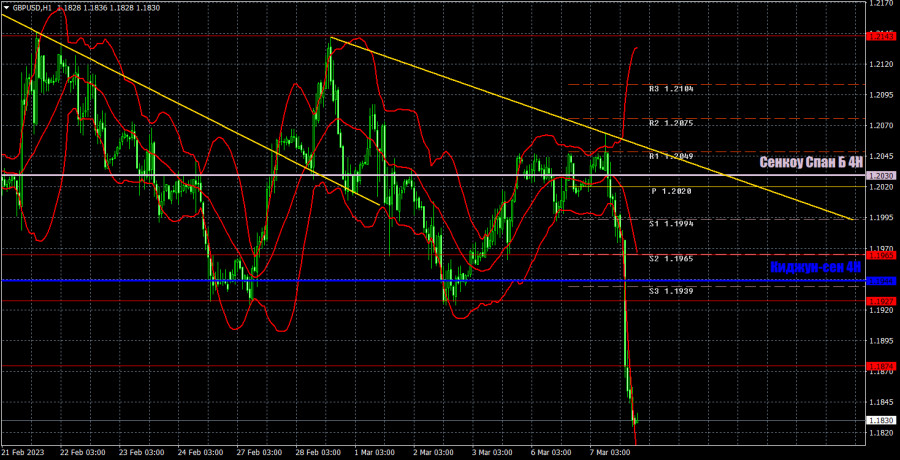
On the 1H timeframe, the pound/dollar pair performed a steep drop. A new descending trend line has been formed and it is located much lower than the lines of the Ichimoku indicator. It signals a further downward movement. So far, the couple has not even been able to climb a little. The decline is likely to continue in the European session. On March 8, one should pay attention to the following key levels: 1.1486, 1.1645, 1.1760, 1.1874, 1.1927, 1.1965, 1.2143, 1.2185, 1.2269. Apart from that, investors should monitor The Senkou Span B (1.2030) and Kijun-sen (1.1944), looking for bounces or breakouts. It would be wise to set the Stop Loss if the price goes along the trend by 20 pips. The lines of the Ichimoku indicator could move during the day. Investors should take it into account when determining trading signals. On the chart, there are support and resistance levels. They can be used to lock in profits. The economic calendar for the UK is empty on Wednesday. Jerome Powell will deliver his second speech to Congress and the ADP report will be published.
Indicators' description:
Support and resistance levels are thick red lines where the price movement may end. They do not provide trading signals.
The Kijun-sen and Senkou Span B lines are the lines of the Ichimoku indicator shifted to the 1H chart from the 4H one. These are strong lines.
Extreme levels are thin red lines from which the price bounced earlier. They create trading signals.
Yellow lines are trend lines, trend channels, and any other technical patterns.
Indicator 1 on the COT charts is the net positions of each category of traders.
Indicator 2 on the COT charts is the net positions for the Non-commercial group of traders.