empty
10.07.2023 10:52 AM
EUR/USD and GBP/USD: Trading plan for beginners on July 10, 2023

Details of the economic calendar on July 7

U.S. labor market continues to show strength. Statistical data on the U.S. labor market indicates that the number of non-farm payrolls increased by 209,000 in June, slightly below the expected growth of 225,000. The unemployment rate also decreased to 3.6%, in line with expectations. These indicators indicate the ongoing strengthening of the American labor market.

Analysis of trading charts from July 7

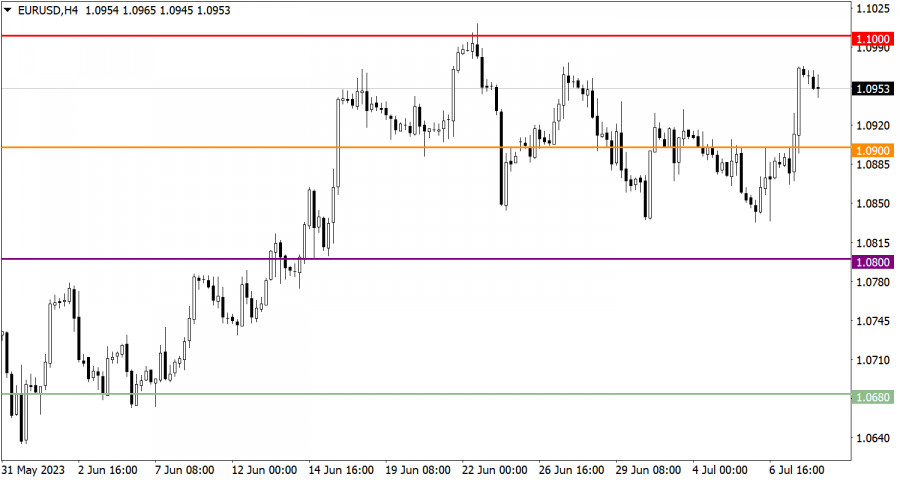
The EUR/USD currency pair has nearly fully recovered its value after a recent correction. However, a resistance level around 1.1000 still stands in the way of buyers.

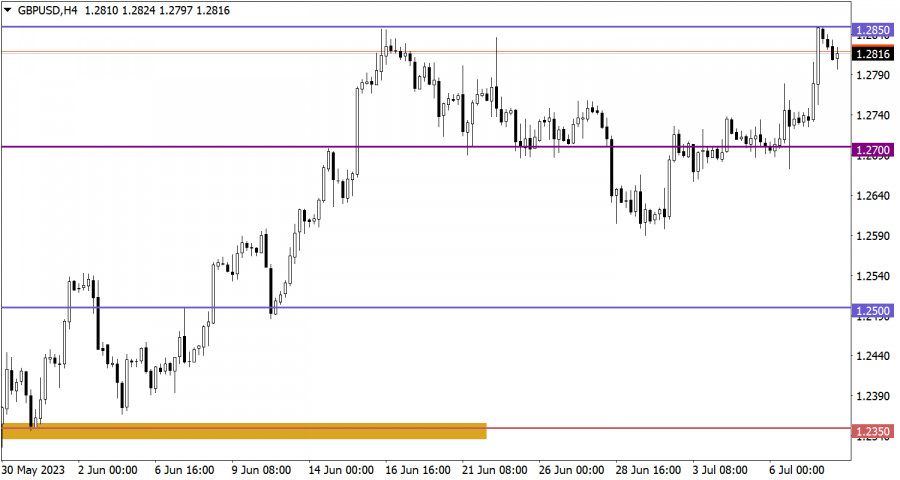
The GBP/USD pair has reached a local high in the process of inertial movement within a medium-term upward trend. As a result, there has been a reduction in long positions, leading to a price pullback.

This image is no longer relevant

Economic calendar for July 10

Monday is traditionally accompanied by an empty macroeconomic calendar. No important statistical data is expected to be published in the European Union, the United Kingdom, and the United States.

Therefore, investors and traders intend to rely on the incoming flow of information and news.

EUR/USD trading plan for July 10

Due to the technical overbought signal of the euro in the short-term and intraday periods, a price pullback is possible. To continue the current upward cycle, market participants need to overcome the resistance level around 1.1000. If the price remains consistently above this level, it may stimulate an increase in long positions.

This image is no longer relevant

GBP/USD trading plan for July 10

In this situation, the return of the price to the local high indicates a prevailing bullish sentiment among market participants. The pullback we are observing can serve as a stage for regrouping trading forces before further growth. To confirm the continuation of the upward trend, it is necessary to keep the price above the level of 1.2850, which may trigger a technical signal for further growth.

This image is no longer relevant

What's on the charts

The candlestick chart type is white and black graphic rectangles with lines above and below. With a detailed analysis of each individual candle, you can see its characteristics relative to a particular time frame: opening price, closing price, intraday high and low.

Horizontal levels are price coordinates, relative to which a price may stop or reverse its trajectory. In the market, these levels are called support and resistance.

Circles and rectangles are highlighted examples where the price reversed in history. This color highlighting indicates horizontal lines that may put pressure on the asset's price in the future.

The up/down arrows are landmarks of the possible price direction in the future.

Seleccione el marco de tiempo
5
min
15
min
30
min
1
hora
4
horas
1
día
1
s.
Gana con los cambios en el valor de las criptomonedas con InstaForex.
Descarga MetaTrader 4 y abre tu primera operación.
  • Grand Choice
    Contest by
    InstaForex
    InstaForex always strives to help you
    fulfill your biggest dreams.
    UNIRSE AL CONCURSO

Recommended Stories

GBP/USD: plan para la sesión europea del 9 de mayo. Informes COT (Commitment of Traders, análisis de las operaciones de ayer). La libra se desplomó tras la bajada de tasas

GBP/USD: plan para la sesión europea del 9 de mayo. Informes COT (Commitment of Traders, análisis de las operaciones de ayer). La libra se desplomó tras la bajada de tasas

Miroslaw Bawulski 07:46 2025-05-09 UTC+2

EUR/USD: plan para la sesión europea del 9 de mayo. Informes COT (Commitment of Traders, análisis de las operaciones de ayer). El euro vuelve a caer

Ayer se formaron varios puntos de entrada al mercado. Veamos el gráfico de 5 minutos y analicemos lo que ocurrió. En mi pronóstico matutino presté atención al nivel de 1.1269

Miroslaw Bawulski 07:46 2025-05-09 UTC+2

GBP/USD: plan para la sesión europea del 7 de mayo. Informes COT (Commitment of Traders, análisis de las operaciones de ayer). Qué esperar del Banco de Inglaterra

Ayer se formaron varios puntos de entrada al mercado. Veamos el gráfico de 5 minutos y analicemos lo que ocurrió. En mi pronóstico matutino presté atención al nivel 1.3335

Miroslaw Bawulski 07:39 2025-05-08 UTC+2

EUR/USD: plan para la sesión europea del 8 de mayo. Informes COT (análisis de las operaciones de ayer). La Fed sigue esperando

Ayer se formaron varios puntos de entrada al mercado. Veamos el gráfico de 5 minutos y analicemos lo que ocurrió. En mi pronóstico matutino presté atención al nivel 1.1379

Miroslaw Bawulski 07:39 2025-05-08 UTC+2

GBP/USD: plan para la sesión europea del 2 de mayo. Informes Commitment of Traders COT (análisis de las operaciones de ayer). La libra en una situación complicada

Ayer se formaron varios puntos de entrada al mercado. Veamos el gráfico de 5 minutos y analicemos lo que ocurrió allí. En mi pronóstico matutino presté atención al nivel 1.3282

Miroslaw Bawulski 07:32 2025-05-02 UTC+2

EUR/USD: plan para la sesión europea del 2 de mayo. Informes Commitment of Traders COT (análisis de las operaciones de ayer). El dólar reacciona a cualquier dato positivo

Ayer se formaron varios puntos de entrada al mercado. Veamos el gráfico de 5 minutos y analicemos lo que ocurrió allí. En mi pronóstico matutino presté atención al nivel 1.1320

Miroslaw Bawulski 07:32 2025-05-02 UTC+2

GBP/USD: plan para la sesión europea del 30 de abril. Informes Commitment of Traders COT (análisis de las operaciones de ayer). La libra se prepara para un nuevo salto, pero ¿hacia dónde?

GBP/USD: plan para la sesión europea del 30 de abril. Informes Commitment of Traders COT (análisis de las operaciones de ayer). La libra se prepara para un nuevo salto, pero

Miroslaw Bawulski 08:13 2025-04-30 UTC+2

EUR/USD: plan para la sesión europea del 30 de abril. Informes Commitment of Traders COT (análisis de las operaciones de ayer). El euro se prepara para una fuerte sacudida

Ayer se formó solo un punto de entrada al mercado. Veamos el gráfico de 5 minutos y analicemos lo que sucedió allí. En mi pronóstico de a mañana presté atención

Miroslaw Bawulski 08:13 2025-04-30 UTC+2

GBP/USD: plan para la sesión europea del 29 de abril. Informes Commitment of Traders COT (análisis de las operaciones de ayer). La libra actualiza el máximo mensual

Ayer se formaron varios puntos de entrada al mercado. Veamos el gráfico de 5 minutos y analicemos lo que ocurrió. En mi pronóstico matutino presté atención al nivel de 1.3342

Miroslaw Bawulski 07:40 2025-04-29 UTC+2

EUR/USD: plan para la sesión europea del 29 de abril. Informes Commitment of Traders COT (análisis de las operaciones de ayer). El euro muestra un ligero crecimiento

Ayer no se formaron puntos de entrada al mercado. Propongo echar un vistazo al gráfico de 5 minutos y analizar lo que ocurrió. En mi pronóstico matutino, presté atención

Miroslaw Bawulski 07:40 2025-04-29 UTC+2
¿No puede hablar ahora mismo?
Ingrese su pregunta en el chat.
Widget callback
 

Dear visitor,

Your IP address shows that you are currently located in the USA. If you are a resident of the United States, you are prohibited from using the services of InstaFintech Group including online trading, online transfers, deposit/withdrawal of funds, etc.

If you think you are seeing this message by mistake and your location is not the US, kindly proceed to the website. Otherwise, you must leave the website in order to comply with government restrictions.

Why does your IP address show your location as the USA?

  • - you are using a VPN provided by a hosting company based in the United States;
  • - your IP does not have proper WHOIS records;
  • - an error occurred in the WHOIS geolocation database.

Please confirm whether you are a US resident or not by clicking the relevant button below. If you choose the wrong option, being a US resident, you will not be able to open an account with InstaForex anyway.

We are sorry for any inconvenience caused by this message.