empty
 
 
18.07.2023 10:32 AM
EUR/USD and GBP/USD: Trading plan for beginners on July 18, 2023

Details of the economic calendar on July 17

On Monday, there was a lack of important macroeconomic data in the European Union, the United Kingdom, and the United States. As a result, investors and traders relied on the information flow.

Analysis of trading charts from July 17

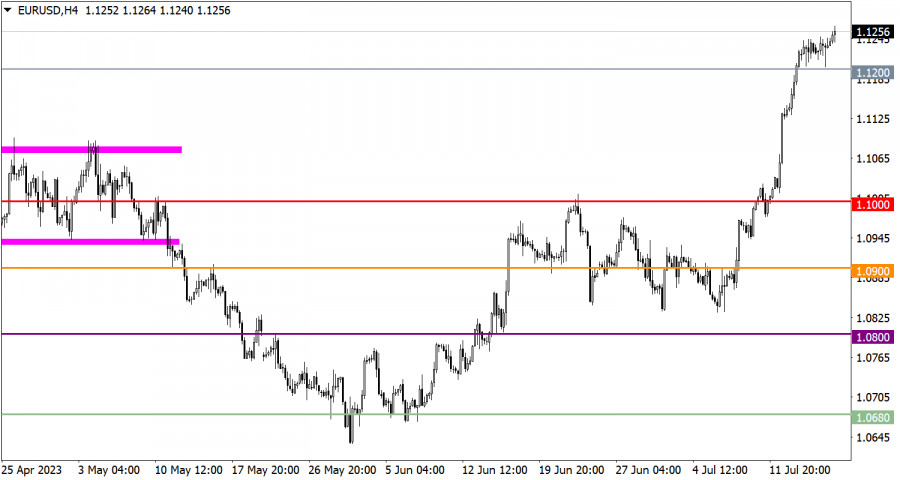
EUR/USD completed a phase of stagnation, reaching a local high in the medium-term trend. This led to an increase in the volume of long positions, which could contribute to further growth in the value of the euro.

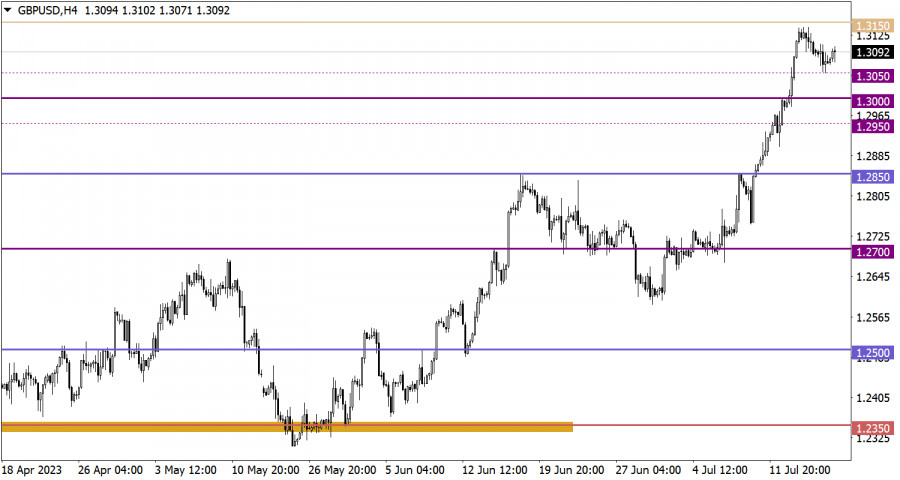
GBP/USD partially recovered its value after a recent pullback. The upper range of the psychological level 1.3000/1.3050 became an important support level, increasing the volume of long positions.

This image is no longer relevant

Economic calendar for July 18

Today, the publication of statistical data on the United States is expected, which may have a mixed trend. The growth rate of retail sales is forecasted to slow down from 1.6% to 1.1%, while industrial production indicators are expected to accelerate from 0.2% to 0.5%.

EUR/USD trading plan for July 18

Despite the technical signal of the euro's overbought condition, the market is experiencing an inertial upward trend. Maintaining the price above the 1.1250 mark could lead to further growth, despite a possible overheating of long positions.

In the event of a price pullback, holding it below the level of 1.1200 could contribute to an increase in the volume of short positions. This could temporarily interrupt the formation of the upward trend.

This image is no longer relevant

GBP/USD trading plan for July 18

In the case of further growth, there is a possibility of updating the local high in the medium-term trend. However, the main increase in the volume of long positions is expected after the price holds above the 1.3150 mark.

Regarding the bearish scenario, the primary increase in the volume of short positions is expected after the price holds below the level of 1.3000.

This image is no longer relevant

What's on the charts

The candlestick chart type is white and black graphic rectangles with lines above and below. With a detailed analysis of each individual candle, you can see its characteristics relative to a particular time frame: opening price, closing price, intraday high and low.

Horizontal levels are price coordinates, relative to which a price may stop or reverse its trajectory. In the market, these levels are called support and resistance.

Circles and rectangles are highlighted examples where the price reversed in history. This color highlighting indicates horizontal lines that may put pressure on the asset's price in the future.

The up/down arrows are landmarks of the possible price direction in the future.

Gana con los cambios en el valor de las criptomonedas con InstaForex.
Descarga MetaTrader 4 y abre tu primera operación.
  • Grand Choice
    Contest by
    InstaForex
    InstaForex always strives to help you
    fulfill your biggest dreams.
    UNIRSE AL CONCURSO
  • Depósito al azar
    ¡Haga un depósito en su cuenta de $3,000 y obtenga $5000 más!
    ¡En Noviembre, sorteamos $5000 dentro de la campaña Depósito afortunado!
    Obtenga la oportunidad de ganar depositando $3,000 en una cuenta de operaciones. Tras haber cumplido esta condición, se convertirá en un participante de la campaña.
    UNIRSE AL CONCURSO
  • Opere de forma inteligente, gane un dispositivo
    Recargue su cuenta con al menos $500, regístrese en el concurso y tenga la oportunidad de ganar dispositivos móviles.
    UNIRSE AL CONCURSO
  • 100% de bonificación
    Su oportunidad única de obtener un bono del 100 % en su depósito
    OBTENER BONO
  • 55% de bonificación
    Solicite un bono del 55% en cada depósito
    OBTENER BONO
  • 30% de bonificación
    Reciba un bono del 30% cada vez que recargue su cuenta
    OBTENER BONO

Recommended Stories

¿No puede hablar ahora mismo?
Ingrese su pregunta en el chat.
Widget callback