empty
 
 
30.10.2023 11:05 AM
EUR/USD, GBP/USD: trading plan for beginners on October 30, 2023

Economic calendar on October 27, 2023:

Last Friday, the macroeconomic calendar was nearly empty. The only report worthy to note was US personal income and spending data.

Statistics details:

Personal Income (m/m) (Sep). Previous: 0.4%, Forecast: 0.4%, Actual: 0.3%

Personal Spending (m/m) (Sep). Previous: 0.4%, Forecast: 0.4%, Actual: 0.7%

Overview of trading charts for October 27, 2023

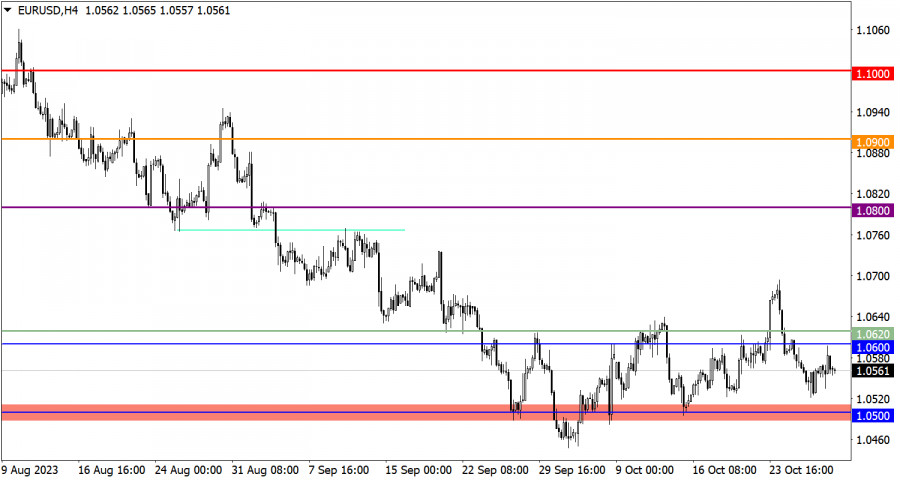
While moving upwards, the euro/dollar pair nearly reached the resistance level of 1.0600. Then the volume of long positions decreased, which allowed the greenback to pare some ground.

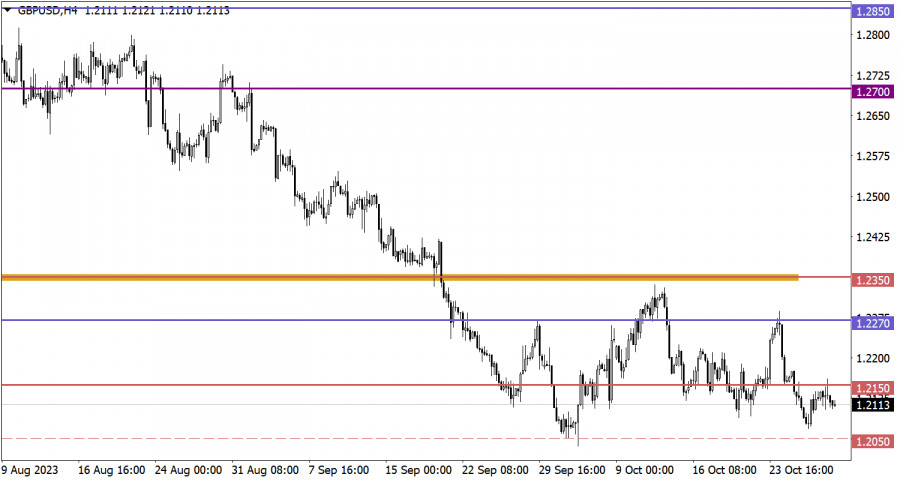
The pound/dollar pair traded in a local uptrend, but no dramatic changes occurred. The quote briefly surged to 1.2150 before reversing and losing value.

This image is no longer relevant

Economic calendar for October 30, 2023

Today's macroeconomic calendar is also bereft of any important news releases, except for UK lending market data.

EUR/USD trading plan for October 30, 2023

The euro/dollar pair is currently pulling back from the resistance level. In the case of a further increase in the volume of short positions, the euro might slide to the support level of 1.0500. However, if the dollar's current bullish run is short-lived and the quote consolidates above 1.0620, the market may move back to the upside.

This image is no longer relevant

GBP/USD trading plan for October 30, 2023

If the quote fails to consolidate above 1.2150, the pound sterling will lose value. A bear case scenario suggests a decline to the 1.2000/1.2150 area. However, if the quote stays firm above 1.2150, the British pound will most likely rise to the levels of 1.2200/1.2250.

This image is no longer relevant

What is shown on trading charts?

Candlestick charts are white and black graphic rectangles with lines above and below. While conducting a detailed analysis of each candlestick, you can notice its features intrinsic to a particular timeframe: the opening price, the closing price, as well as the highest and lowest prices;

Horizontal levels are price coordinates at which the price might pause or reverse. In the market, these levels are called support and resistance.

Circles and rectangles highlight examples where the price earlier reversed. This color highlighting points to horizontal lines that may influence the quote in the future.

Up/down arrows are indicators of possible future price directions.

Traders are recommended to read the following article:

EUR/USD and GBP/USD: Trading plan for beginner traders on October 27, 2023

Gana con los cambios en el valor de las criptomonedas con InstaForex.
Descarga MetaTrader 4 y abre tu primera operación.
  • Grand Choice
    Contest by
    InstaForex
    InstaForex always strives to help you
    fulfill your biggest dreams.
    UNIRSE AL CONCURSO
  • Depósito al azar
    ¡Haga un depósito en su cuenta de $3,000 y obtenga $5000 más!
    ¡En Noviembre, sorteamos $5000 dentro de la campaña Depósito afortunado!
    Obtenga la oportunidad de ganar depositando $3,000 en una cuenta de operaciones. Tras haber cumplido esta condición, se convertirá en un participante de la campaña.
    UNIRSE AL CONCURSO
  • Opere de forma inteligente, gane un dispositivo
    Recargue su cuenta con al menos $500, regístrese en el concurso y tenga la oportunidad de ganar dispositivos móviles.
    UNIRSE AL CONCURSO
  • 100% de bonificación
    Su oportunidad única de obtener un bono del 100 % en su depósito
    OBTENER BONO
  • 55% de bonificación
    Solicite un bono del 55% en cada depósito
    OBTENER BONO
  • 30% de bonificación
    Reciba un bono del 30% cada vez que recargue su cuenta
    OBTENER BONO

Recommended Stories

¿No puede hablar ahora mismo?
Ingrese su pregunta en el chat.
Widget callback