empty
29.03.2024 07:04 AM
Trading plan for GBP/USD on March 29. Simple tips for beginners

Analyzing Thursday's trades:

GBP/USD on 1H chart

This image is no longer relevant

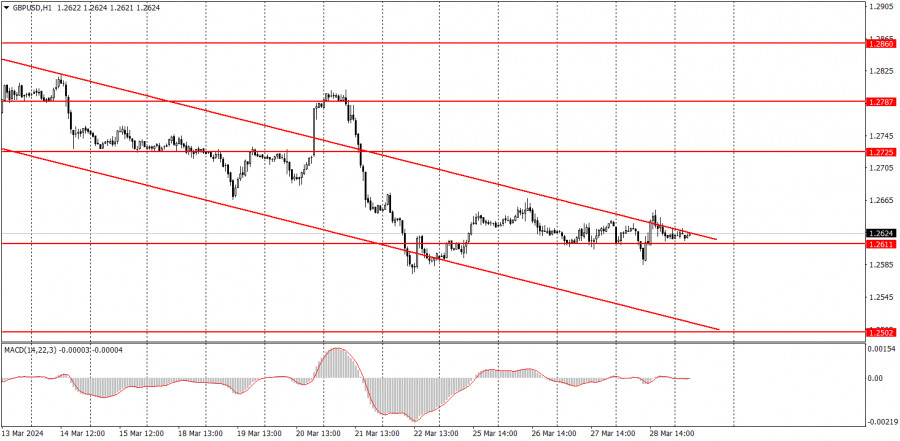
The GBP/USD pair showed a flat phase on Thursday. Even on the hourly chart, it's clear that the price has been trading along the 1.2611 level for the fifth consecutive day, ignoring the level itself. Such movement only leads to false signals, as not only is the volatility quite low, but the pair is also moving sideways. This is the worst combination of factors. Now there's no doubt that the price will leave the descending channel, and this exit will be meaningless. After that, the price could resume its decline, continue the flat movement, or start to rise. After all, the British pound remains within the sideways channel on the 24-hour timeframe. Now we're seeing a flat phase on almost all charts. For 4 months, the price cannot break out of the 1.25-1.28 range.

There was no news in the UK yesterday, while the US GDP report came out stronger than expected (+3.4%), the initial jobless claims report was stronger than expected, and the University of Michigan's Consumer Sentiment Index was stronger than expected. Therefore, it would have been logical for the dollar to rise. But it didn't, which isn't even surprising anymore.

GBP/USD on 5M chart

This image is no longer relevant

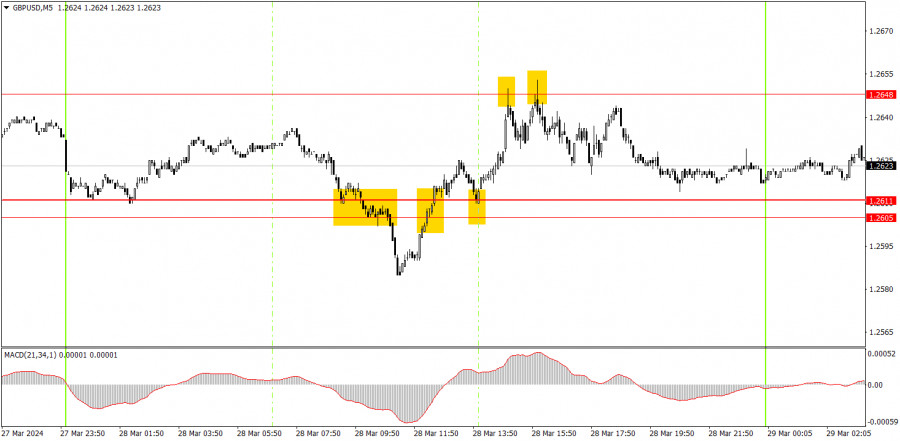
Several trading signals were generated on the 5-minute timeframe. Initially, the pair settled below the 1.2605-1.2611 area but failed to fall by 20 pips. Then the pair suddenly started to correct higher, which disrupts the downward movement. After that, the pair settled above the 1.2605-1.2611 area and tested the level of 1.2648. Traders cold have earned approximately 15 pips with the second trade. Rebounds from the 1.2648 level should also have been used for opening positions (for selling), and beginners could earn another 10-15 pips.

Trading tips on Friday:

On the hourly chart, the downtrend persists. Unfortunately, the market continues to trade in an illogical and sluggish way, and recently, it has been mostly moving sideways. Nevertheless, the British currency has been gradually declining, which is somewhat encouraging. The movements are currently very chaotic, with little logic behind them.

Today, we will expect signals around the 1.2605-1.2611 area. We can either work with rebounds from it or wait for the price to overcome them, which might slightly strengthen the current movement and trigger a new decline. Nevertheless, we're talking about very weak movements.

The key levels on the 5M chart are 1.2372-1.2387, 1.2457, 1.2502, 1.2544, 1.2605-1.2611, 1.2648, 1.2691, 1.2725, 1.2787-1.2791, 1.2848-1.2860, 1.2913, 1.2981-1.2993. There are no important events scheduled in the UK. The US docket will feature secondary reports on Personal Consumption Expenditures Prices, Personal Income, and Personal Spending. In addition, Federal Reserve Chief Jerome Powell will deliver an important speech, but it will occur late in the evening and will not influence the pair's movement during the day.

Basic trading rules:

1) Signal strength is determined by the time taken for its formation (either a bounce or level breach). A shorter formation time indicates a stronger signal.

2) If two or more trades around a certain level are initiated based on false signals, subsequent signals from that level should be disregarded.

3) In a flat market, any currency pair can produce multiple false signals or none at all. In any case, the flat trend is not the best condition for trading.

4) Trading activities are confined between the onset of the European session and mid-way through the U.S. session, after which all open trades should be manually closed.

5) On the 30-minute timeframe, trades based on MACD signals are only advisable amidst substantial volatility and an established trend, confirmed either by a trendline or trend channel.

6) If two levels lie closely together (ranging from 5 to 15 pips apart), they should be considered as a support or resistance zone.

How to read charts:

Support and Resistance price levels can serve as targets when buying or selling. You can place Take Profit levels near them.

Red lines represent channels or trend lines, depicting the current market trend and indicating the preferable trading direction.

The MACD(14,22,3) indicator, encompassing both the histogram and signal line, acts as an auxiliary tool and can also be used as a signal source.

Significant speeches and reports (always noted in the news calendar) can profoundly influence the price dynamics. Hence, trading during their release calls for heightened caution. It may be reasonable to exit the market to prevent abrupt price reversals against the prevailing trend.

Beginners should always remember that not every trade will yield profit. Establishing a clear strategy coupled with sound money management is the cornerstone of sustained trading success.

Summary
Urgency
Analytic
Stanislav Polyanskiy
Start trade
Gana con los cambios en el valor de las criptomonedas con InstaForex.
Descarga MetaTrader 4 y abre tu primera operación.
  • Grand Choice
    Contest by
    InstaForex
    InstaForex always strives to help you
    fulfill your biggest dreams.
    UNIRSE AL CONCURSO

Recommended Stories

Recomendaciones para operar y análisis de las operaciones con el par GBP/USD el 24 de julio. La libra no encontró razones para hacer una pausa.

Análisis del par GBP/USD 5M. El par de divisas GBP/USD durante el miércoles, a diferencia del par EUR/USD, continuó tranquilamente su movimiento hacia el Norte. Durante el día no hubo

Paolo Greco 07:22 2025-07-24 UTC+2

Recomendaciones para operar y análisis de las operaciones con el par EUR/USD el 24 de julio. Los acuerdos comerciales de Trump no ayudaron al dólar.

Análisis del par EUR/USD 5M. El par de divisas EUR/USD durante el miércoles no mostró ningún movimiento interesante, y el mercado no mostró ningún interés en los acuerdos comerciales

Paolo Greco 07:21 2025-07-24 UTC+2

GBP/USD: plan para la sesión europea del 23 de julio. Informes COT (análisis de las operaciones de ayer). La libra actualizó el máximo semanal

Ayer se formaron varios puntos de entrada al mercado. Vamos a ver el gráfico de 5 minutos y entender qué ocurrió. En mi pronóstico de la mañana presté atención

Miroslaw Bawulski 08:47 2025-07-23 UTC+2

EUR/USD: plan para la sesión europea del 23 de julio. Informes COT (análisis de las operaciones de ayer). El euro creció bastante bien

Ayer se formaron varios puntos de entrada al mercado. Vamos a ver el gráfico de 5 minutos y entender qué pasó allí. En mi pronóstico de la mañana presté atención

Miroslaw Bawulski 08:47 2025-07-23 UTC+2

Recomendaciones para operar y análisis de las operaciones con el par GBP/USD el 23 de julio. El crecimiento lógico continúa.

El par de divisas GBP/USD también continúa su movimiento ascendente durante el martes. La nueva caída de la moneda estadounidense puede intentarse vincular con el discurso de Jerome Powell, como

Paolo Greco 07:54 2025-07-23 UTC+2

Recomendaciones para operar y análisis de las operaciones con el par EUR/USD el 23 de julio. La caída predecible del dólar continúa.

El par de divisas EUR/USD durante el martes permaneció inmóvil durante la primera mitad del día y en la segunda mitad se negoció al alza. En la segunda mitad

Paolo Greco 07:54 2025-07-23 UTC+2

EUR/USD: plan para la sesión europea del 22 de julio. Informes COT (análisis de las operaciones de ayer). Los compradores del euro se activaron

Ayer se formaron varios puntos de entrada al mercado. Vamos a mirar el gráfico de 5 minutos y analizar lo que ocurrió. En mi pronóstico de la mañana presté atención

Miroslaw Bawulski 07:51 2025-07-22 UTC+2

Cómo operar el par GBP/USD el 22 de julio. Consejos simples y análisis de operaciones para principiantes.

El par GBP/USD mostró el lunes exactamente los mismos movimientos que el par EUR/USD. Por lo tanto, es evidente que en todo el mercado el dólar estadounidense comenzó una nueva

Paolo Greco 07:51 2025-07-22 UTC+2

Cómo operar el par EUR/USD el 22 de julio. Consejos simples y análisis de operaciones para principiantes.

El par de divisas EUR/USD aparentemente completó el lunes una tendencia bajista de tres semanas. Recordemos que durante al menos las últimas dos semanas, desde Estados Unidos llegaba una gran

Paolo Greco 07:51 2025-07-22 UTC+2

EUR/USD: plan para la sesión europea del 21 de julio. Informes COT (análisis de las operaciones de ayer). La corrección del euro se acerca a su final

El viernes pasado se formó solo un punto de entrada al mercado. Veamos el gráfico de 5 minutos y analicemos lo que ocurrió. En mi pronóstico de la mañana, presté

Miroslaw Bawulski 08:11 2025-07-21 UTC+2
¿No puede hablar ahora mismo?
Ingrese su pregunta en el chat.
Widget callback
 

Dear visitor,

Your IP address shows that you are currently located in the USA. If you are a resident of the United States, you are prohibited from using the services of InstaFintech Group including online trading, online transfers, deposit/withdrawal of funds, etc.

If you think you are seeing this message by mistake and your location is not the US, kindly proceed to the website. Otherwise, you must leave the website in order to comply with government restrictions.

Why does your IP address show your location as the USA?

  • - you are using a VPN provided by a hosting company based in the United States;
  • - your IP does not have proper WHOIS records;
  • - an error occurred in the WHOIS geolocation database.

Please confirm whether you are a US resident or not by clicking the relevant button below. If you choose the wrong option, being a US resident, you will not be able to open an account with InstaForex anyway.

We are sorry for any inconvenience caused by this message.