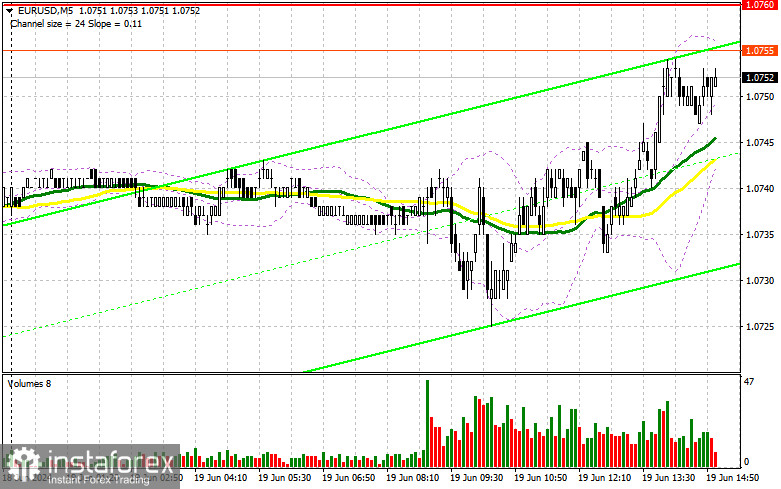
In my morning forecast, I focused on the 1.0710 level and planned to make market entry decisions based on it. Let's look at the 5-minute chart and understand what happened there. A decline occurred, but the test and formation of a false breakout did not materialize. For this reason, it was not possible to find suitable entry points into the market. The technical picture for the second half of the day still needs to be revised.
To open long positions on EUR/USD:
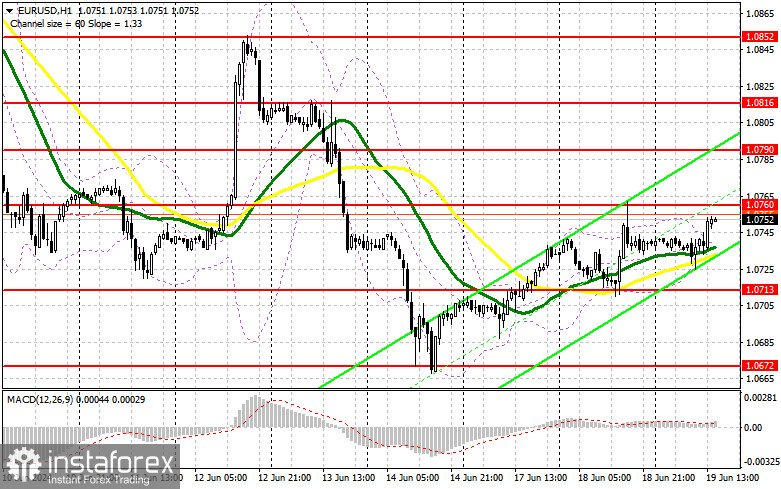
The absence of Eurozone data affected market volatility, as expected. Unfortunately, there is no significant data in the second half of the day either, which could help the euro continue its growth. Therefore, be extremely cautious when buying at the current highs. The NAHB Housing Market Index is unlikely to lead to an increase in trading volume, so I will act according to the morning scenario. Only a decline and the formation of a false breakout around 1.0713 will be a suitable entry point for long positions, aiming to update 1.0760 – a resistance level that has not yet been breached. A breakout and an upward retest of this range will strengthen the pair with a chance to rise towards 1.0790. The furthest target will be the 1.0816 high, where I will take profits. Testing this level will give buyers an advantage. In case of a decline in EUR/USD and a lack of activity around 1.0713 in the second half of the day, which is also unlikely, the pressure on the pair will noticeably increase, leading to a new euro fall. In this case, I will enter the market only after forming a false breakout around the next support level at 1.0672. I plan to open long positions immediately on a rebound from 1.0642, targeting an upward correction of 30-35 points within the day.
To open short positions on EUR/USD:
Sellers have yet to have a chance to assert themselves, and all the focus is now on the nearest resistance at 1.0760, from which I plan to act. A false breakout there will be a suitable entry point for short positions, aiming to drop the pair to the support level of 1.0713. A breakout and consolidation below this range, along with a retest from the bottom up, will provide another point for selling with a movement towards the new low of 1.0672, where I expect more active bullish actions. The furthest target will be the 1.0642 low, where I will take profits. In case of an upward movement of EUR/USD in the second half of the day and a lack of bears at 1.0760, buyers will be able to continue the upward correction. In this case, I will postpone selling until testing the next resistance at 1.0790. There, I will also sell, but only after a failed consolidation. I plan to open short positions immediately on a rebound from 1.0816, targeting a downward correction of 30-35 points.
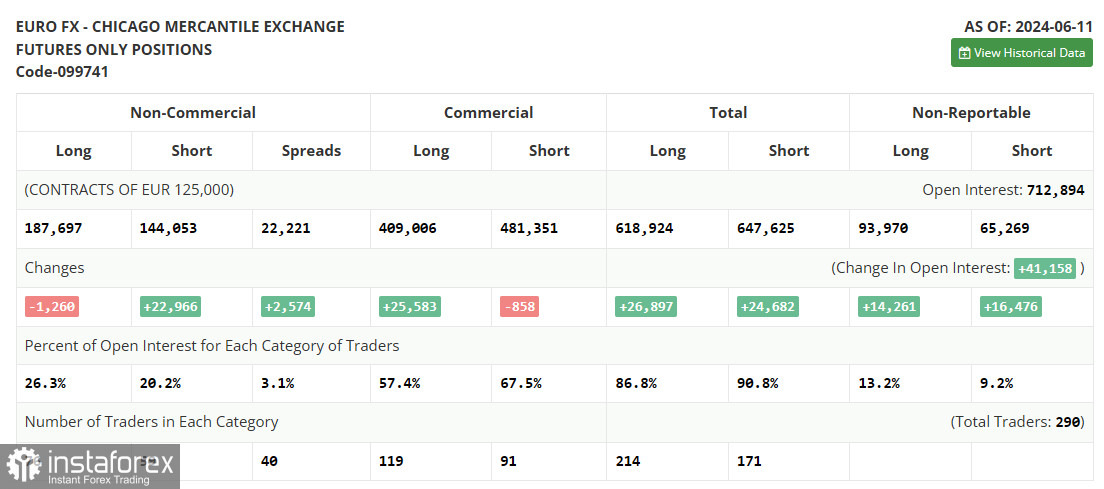
The COT (Commitment of Traders) report for June 11 showed an increase in short positions and a decrease in long ones. This is due to the Federal Reserve's meeting and the latest US economic data. The central bank's firm stance on interest rates led to some shift in the balance of power, and now it is far from certain that the European currency will be able to regain its upward trend in the near future. Everything indicates that, at best, we will remain in the channel, and at worst, we will continue to fall. The ECB's dovish policy and the Fed's hawkish stance will contribute to this. The COT report indicates that long non-commercial positions decreased by 1,260 to 187,697, while short non-commercial positions increased by 22,966 to 144,053. As a result, the spread between long and short positions increased by 2,574.
Indicator Signals:
Moving Averages
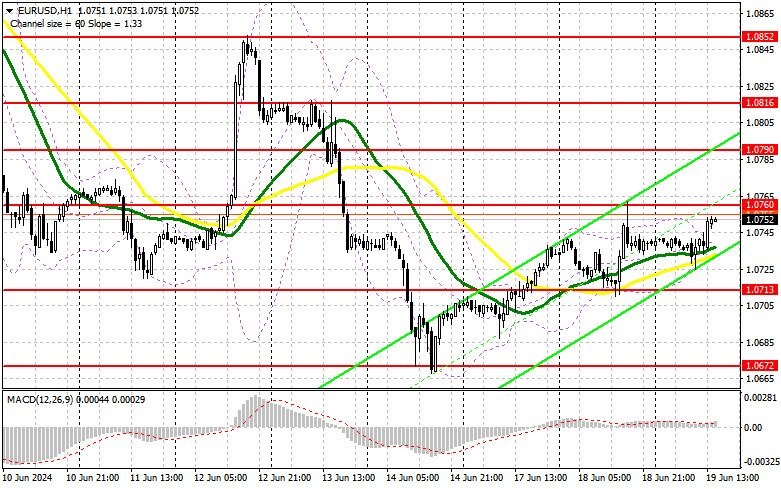
Trading is conducted around the 30 and 50-day moving averages, indicating a sideways market.
Note: The period and prices of the moving averages are considered by the author on the H1 hourly chart, differing from the general definition of classical daily moving averages on the D1 daily chart.
Bollinger Bands
In case of a decline, the lower boundary of the indicator, around 1.0710, will act as support.
Indicator Descriptions:
- Moving Average (MA): Determines the current trend by smoothing volatility and noise. Period: 50. Marked in yellow on the chart.
- Moving Average (MA): Determines the current trend by smoothing volatility and noise. Period: 30. Marked in green on the chart.
- MACD (Moving Average Convergence/Divergence): Fast EMA period 12, Slow EMA period 26, SMA period 9.
- Bollinger Bands: Period 20.
- Non-commercial traders: Speculators such as individual traders, hedge funds, and large institutions use the futures market for speculative purposes and meet certain requirements.
- Long non-commercial positions: The total long open positions of non-commercial traders.
- Short non-commercial positions: The total short open positions of non-commercial traders.
- Total non-commercial net position: The difference between the short and long positions of non-commercial traders.