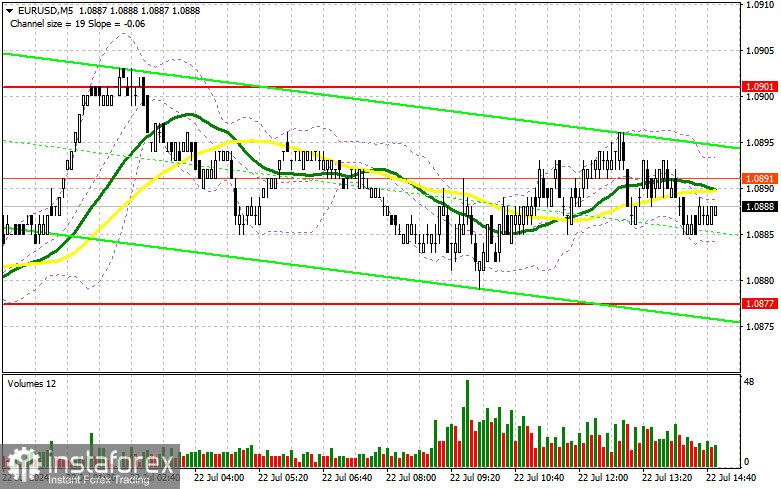
I focused on the 1.0880 level in my morning forecast and planned to base my market entry decisions on this level. Let's look at the 5-minute chart to see what happened. The decline occurred, but it did not reach the test level or form a false breakout, which prevented entry into the market. The technical picture for the second half of the day has been slightly revised.
To Open Long Positions on EUR/USD:
As shown on the chart, the 10-point volatility in the first half of the day left traders with no opportunity for active trading. What is most frustrating is that the second half of the day might follow the same scenario. The lack of economic data will primarily cause market inactivity, resulting in low trading volumes. For this reason, I will stick to the morning plan: I prefer to act on a decline after a false breakout forms around the new support at 1.0877, established from the morning trades. Only this will create favorable conditions for building long positions as the upward trend develops, with the prospect of reaching 1.0901 – the new resistance. A breakout and renewal of this range from top to bottom will strengthen the pair with a chance of growth towards 1.0919. The furthest target will be the maximum at 1.0939, where I will take profit. In the case of a decline in EUR/USD and a lack of activity around 1.0877 in the second half of the day, as seems likely, sellers will become active, targeting further correction. In this case, I will enter only after forming a false breakout around the next support at 1.0860. I plan to open long positions immediately on a rebound from 1.0840, with a target of an upward correction of 30-35 points within the day.
To Open Short Positions on EUR/USD:
Sellers are not very active, which is understandable given that there is no particular reason to push the euro further down, and it is unlikely that one will appear. Therefore, be very cautious with sales on a breakout. It is better to act contrary to the rise. Forming a false breakout around 1.0901 will give a good entry point into short positions aiming to bring the pair down to the support at 1.0877, where the moving averages slightly above favor the bulls. A breakout and consolidation below this range, followed by a retest from bottom to top, will return pressure on the euro and provide another selling point towards the minimum at 1.0860, where I expect more active euro buyers. The furthest target will be the area of 1.0840, where I will take profit. Testing this level will severely harm the bull market. In the case of an upward movement in EUR/USD in the second half of the day and the absence of bears at 1.0901, which is also unlikely, buyers will achieve further growth of the pair. In this case, I will postpone sales until testing the next resistance at 1.0919. There, I will also sell, but only after an unsuccessful consolidation. I plan to open short positions immediately on a rebound from 1.0939, with a target of a downward correction of 30-35 points.
The COT Report (Commitment of Traders):
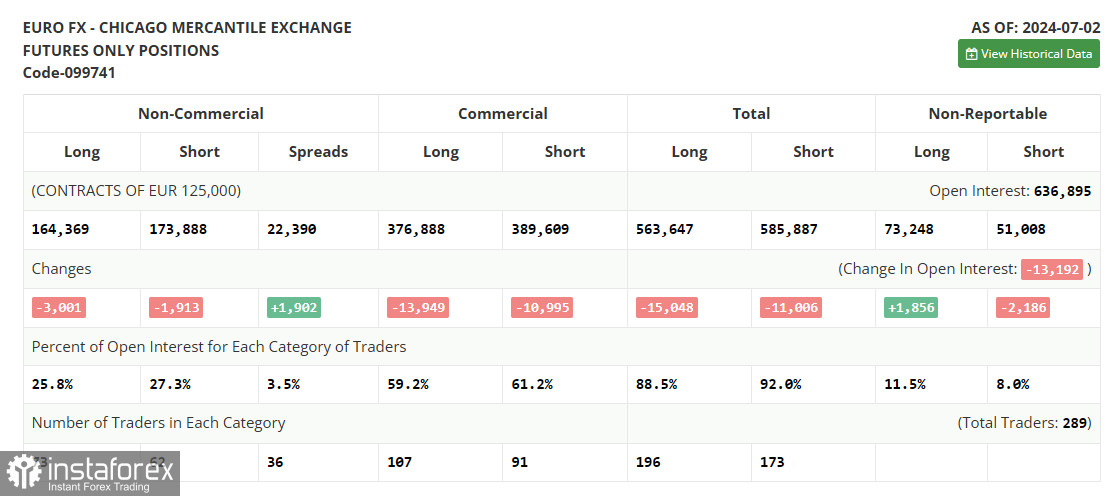
The COT report for July 9th showed a reduction in both short and long positions. The bull market needs a break. Powell's speech could influence the dollar's direction, and US retail sales data might impact the pair's reversal and renew interest in the US dollar. Therefore, the US dollar should not be written off just yet. The COT report indicated that long non-commercial positions decreased by 3,001 to 164,369, while short non-commercial positions fell by 1,913 to 173,888. As a result, the spread between long and short positions increased by 1,902.
Indicator Signals:
Moving Averages:
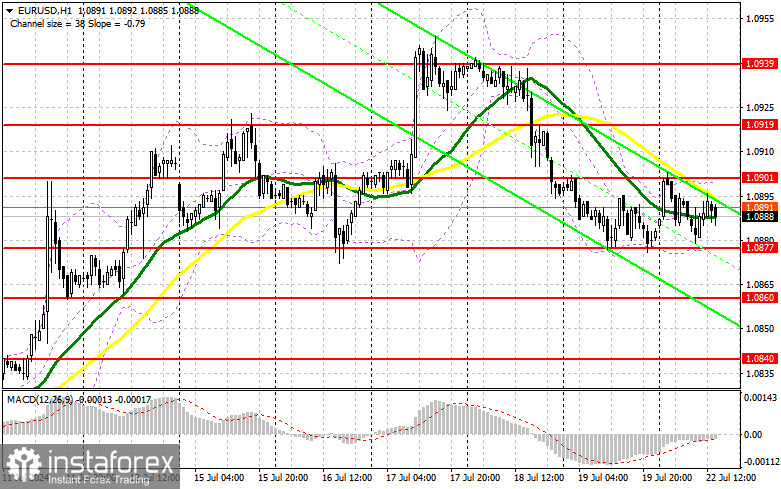
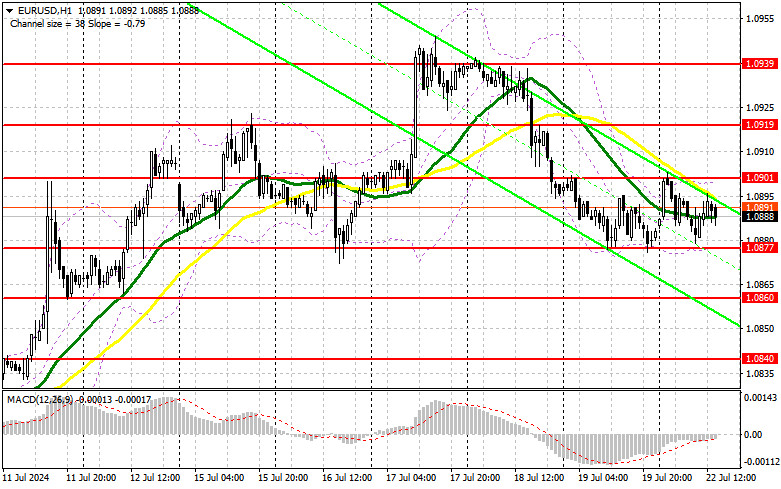
Trading is conducted around the 30-day and 50-day moving averages, indicating a sideways market.
Note: The author considers the period and prices of moving averages on the H1 hourly chart, which differs from the general definition of classical daily moving averages on the D1 daily chart.
Bollinger Bands:
In the case of a decline, the indicator's lower boundary, around 1.0877, will act as support.
Indicator Descriptions:
- Moving Average (determines the current trend by smoothing volatility and noise). Period 50. Marked in yellow on the chart.
- Moving Average (determines the current trend by smoothing volatility and noise). Period 30. Marked in green on the chart.
- MACD Indicator (Moving Average Convergence/Divergence). Fast EMA period 12. Slow EMA period 26. SMA period 9.
- Bollinger Bands. Period 20.
- Non-commercial traders - speculators, such as individual traders, hedge funds, and large institutions, use the futures market for speculative purposes and meet certain requirements.
- Long non-commercial positions represent the total long open position of non-commercial traders.
- Short non-commercial positions represent the total short open positions of non-commercial traders.
- Total non-commercial net position is the difference between non-commercial traders' short and long positions.