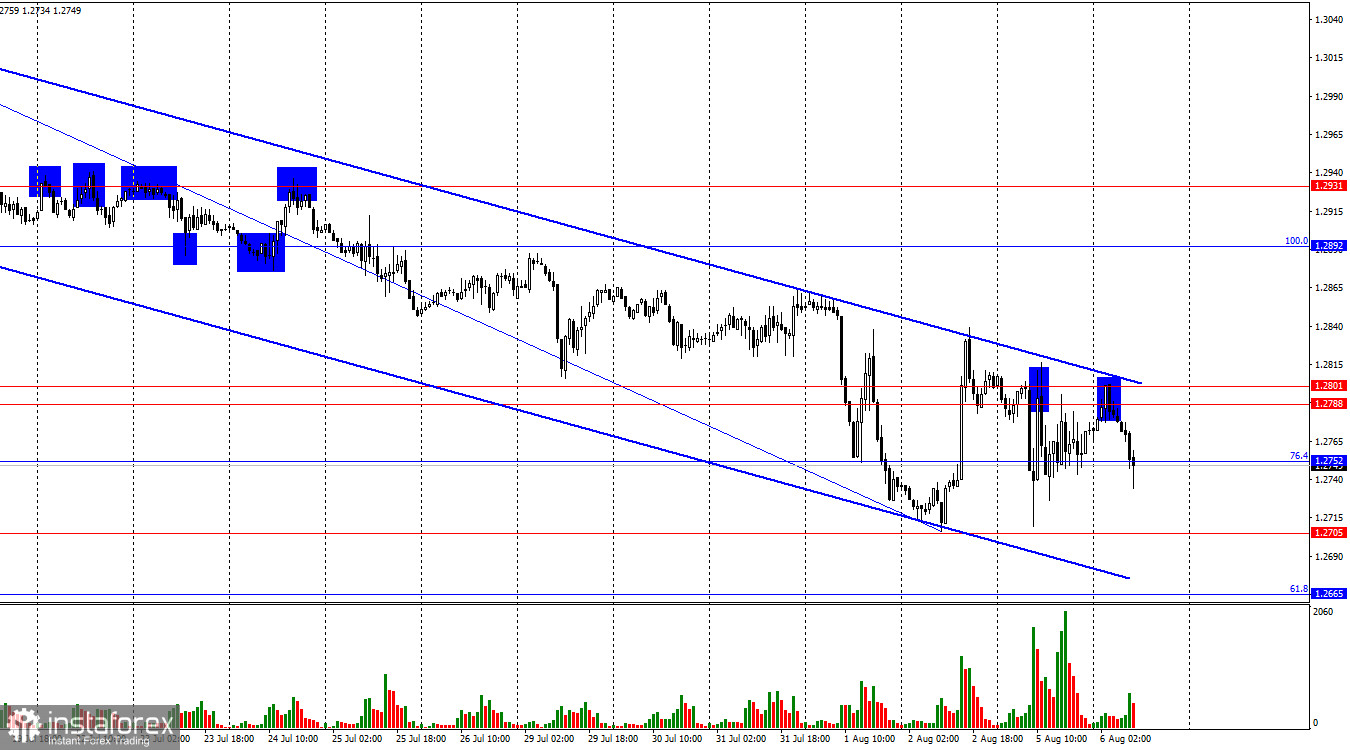
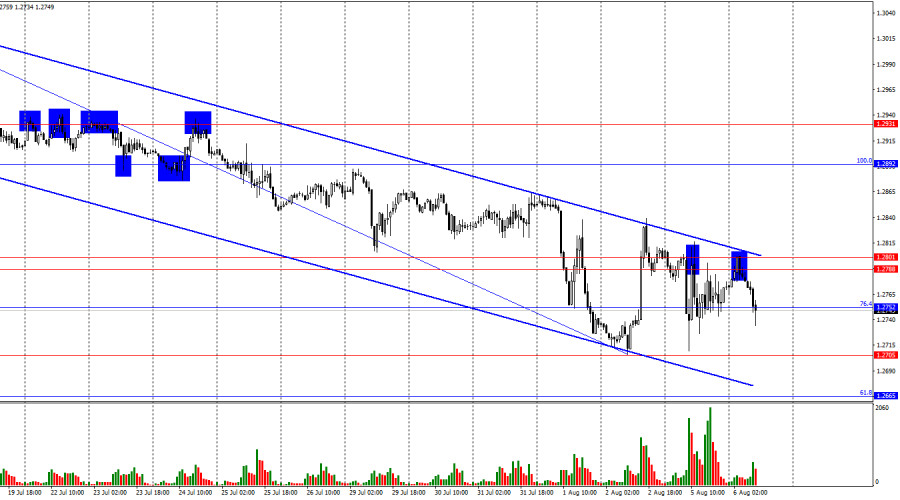
On the hourly chart, the GBP/USD pair on Monday rebounded twice from the resistance zone at 1.2788–1.2801, and again today. As a result, a reversal occurred in favor of the US dollar and consolidated below the 76.4% corrective level at 1.2752. Thus, the decline may continue toward the levels of 1.2752 and 1.2665. Despite the dollar experiencing significant problems across the market yesterday, it held its ground against the pound and again began to rise today. The downward trend channel continues to characterize the traders' mood as "bearish."
The wave situation has changed slightly. The last completed upward wave, which started forming on July 2, managed to break the low of the previous upward wave. However, the last downward wave failed to break the low of the previous wave. Therefore, we are currently dealing with a "bullish" trend and a deep corrective wave or series of waves. The rise of the pound may resume, but traders are now forming a corrective wave down. There is no discussion yet of a trend change to "bearish" from a wave perspective. For this, the pair would need to break the last low from July 2. However, the waves are now very long, and in recent weeks, the pound has only been falling. In the short term, the trend is "bearish."
The information background on Monday was not promising for the US dollar. Rumors began to emerge in the market that the U.S. economy is already in a recession, and the Fed will cut the rate in September by 0.50%. Against the pound, the dollar held on, and in the second half of the day in America, the ISM services sector business activity index was released, which turned out to be better than traders' expectations at 51.4 points. One could argue that this index saved the dollar from even bigger problems across the market spectrum. In my view, it is not entirely clear what recession the market was scared of if the US economy grew by 2.8% in the second quarter. The current situation very much resembles market manipulation.
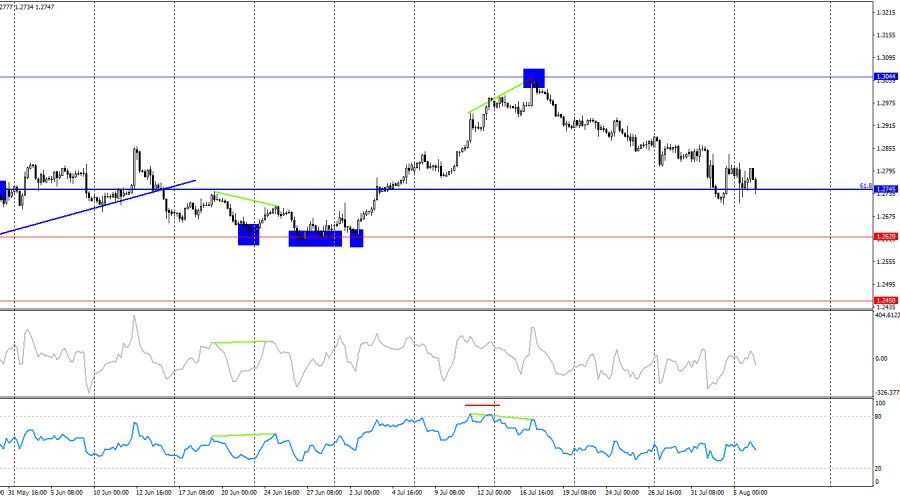
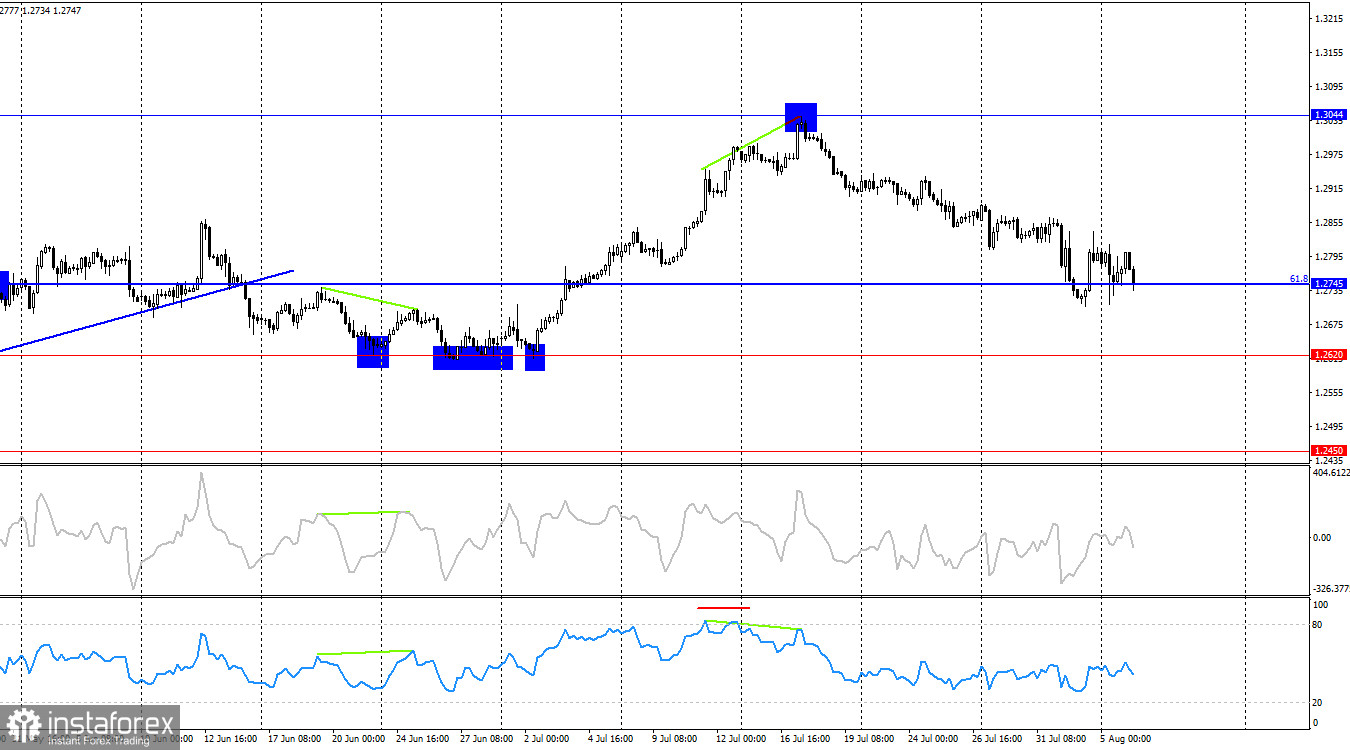
On the 4-hour chart, the pair rebounded from the level of 1.3044 after forming a "bearish" divergence on the RSI indicator and entering the overbought zone. As a result, several signals were received for selling on the senior chart. After consolidating below the 61.8% corrective level at 1.2745, the decline may continue towards the level of 1.2620. A rebound from this level would allow for some rise of the pound.
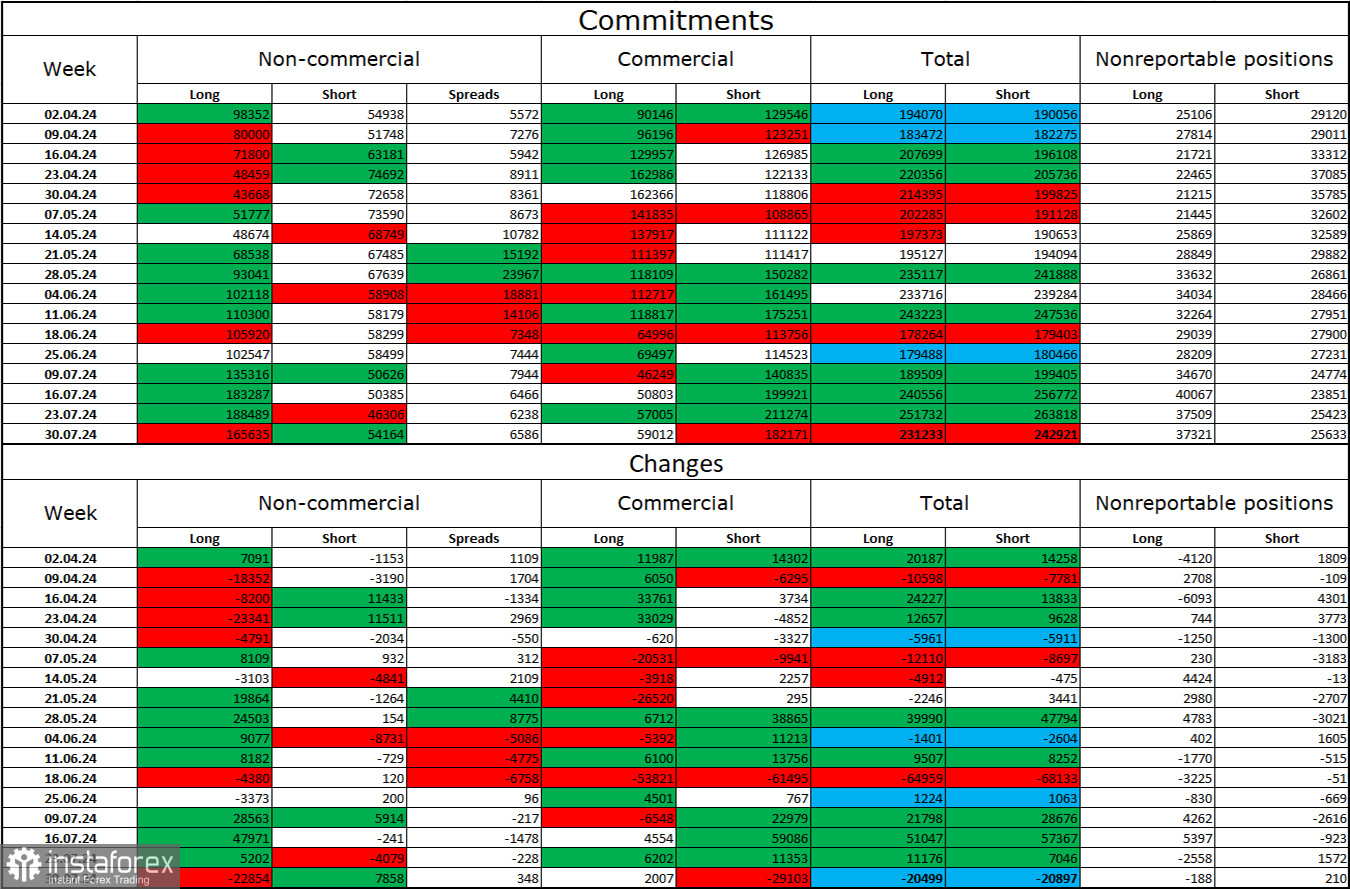
Commitments of Traders (COT) Report:
The sentiment among "Non-commercial" traders has become less "bullish" over the last reporting week. The number of long positions held by speculators decreased by 22,854, and the number of short positions increased by 7,858. The bulls still have a solid advantage. The gap between the number of long and short positions is now 111 thousand, with 165 thousand long positions compared to 54 thousand short positions.
In my view, the pound still has prospects for decline, but the COT reports suggest otherwise. Over the past three months, the number of long positions has increased from 98 thousand to 165 thousand, while the number of short positions has remained unchanged at 54 thousand. I believe that over time, professional players will again begin to shed long positions or increase short positions, as all possible factors for buying the British pound have already been played out. However, remember, this is just an assumption. Graphic analysis indicates a very likely decline soon, but this does not mean that the decline will last several months or half a year.
News Calendar for the US and UK:
On Tuesday, the economic events calendar contains no entries. Today, the influence of the information background on market sentiment will be absent.
Forecast for GBP/USD and Advice to Traders:
The market started the new week very nervously. Yesterday and today, it was possible to take advantage of the hourly chart rebounds from the resistance zone at 1.2788–1.2801. Targets for decline are 1.2705 and 1.2665. Purchases are considered possible after the quotes consolidate above the downward corridor.
Fibonacci level grids are built from 1.2892–1.2298 on the hourly chart and from 1.4248–1.0404 on the 4-hour chart.