Análisis de las operaciones del miércoles:
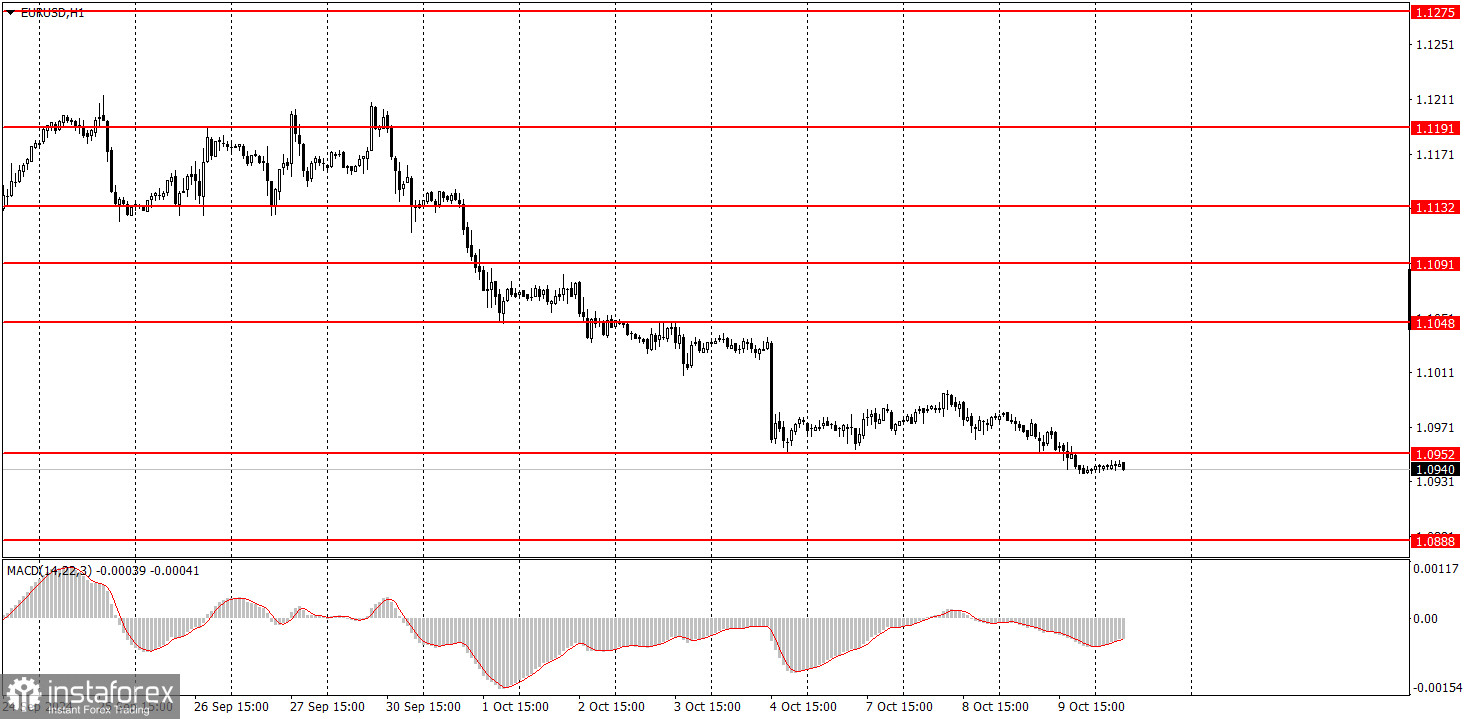
Gráfico de 1H del par EUR/USD.
El par de divisas EUR/USD continuó su movimiento bajista el miércoles, aunque no hubo razones locales para ello. Fíjese bien en la ilustración de arriba: el precio ya se está deslizando hacia abajo. Un movimiento tan débil y al mismo tiempo de retroceso muestra que el dólar estadounidense está siendo comprado continuamente, incluso sin esperar noticias. Y esto significa que el mercado está preparado para compras a medio plazo de la divisa estadounidense. Al menos, se fijará en una tendencia bajista hasta que ocurra algún acontecimiento importante en el mundo, que cambie el estado de ánimo general del mercado.
En este momento, el euro continúa su caída absolutamente legítima, y todo el mundo espera una corrección. Por ello, la cotización puede seguir bajando. Recordemos que hoy se publicará el informe sobre la inflación en EE.UU., y éste es, de hecho, el único acontecimiento importante previsto para esta semana. No nos sorprendería que el mercado utilice este informe para nuevas compras del dólar a pesar de cualquier información sobre el mismo.
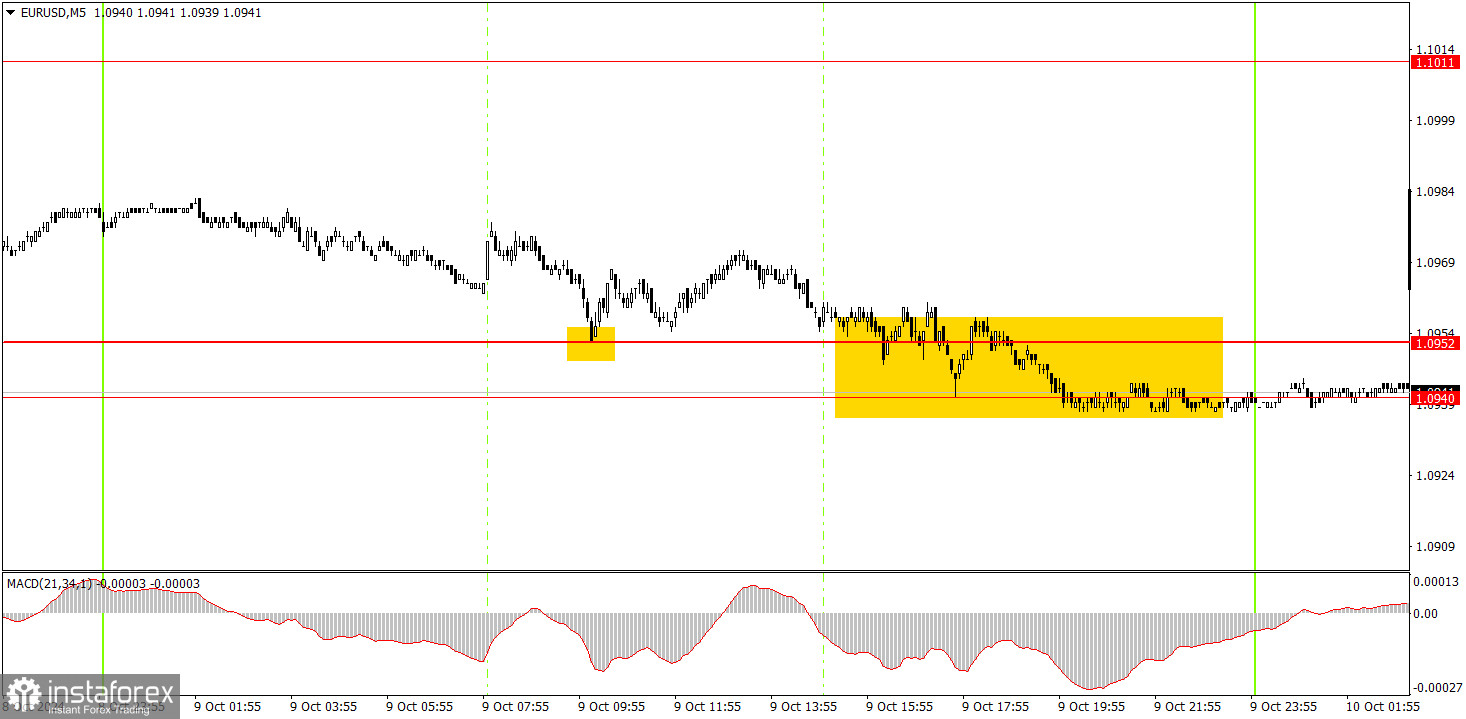
Gráfico de 5M del par EUR/USD.
El miércoles se formó exactamente una señal de trading en el gráfico de 5 minutos. El precio rebotó desde el nivel de 1,0952 durante la sesión europea, pero no logró subir más de 15 pips. Por este motivo, se debería haber activado el Stop Loss en esta operación, que se fijó en el punto de equilibrio. Una consolidación por debajo del nivel de 1,0940 permitirá seguir con la venta del par con un objetivo de 1,0888-1,0896.
Cómo operar el jueves:
En el marco temporal de una hora, el par EUR/USD realizó un gran movimiento hacia una nueva tendencia bajista la semana pasada. Por desgracia, la venta ilógica del dólar podría reanudarse a medio plazo, ya que nadie sabe cuánto tiempo más el mercado va a trabajar en la flexibilización monetaria de la Fed. Pero en este momento todavía hay una tendencia bajista en el marco temporal de una hora. Tras una corrección al alza (o incluso sin ella) podemos esperar una nueva caída de la divisa europea, ya que sigue estando extremadamente sobrecomprada.
El jueves, podemos seguir operando desde la zona de 1,0940-1,0951. Por el momento el precio la ha superado, pero hoy en la sesión estadounidense podría producirse un fuerte impulso al alza debido al informe de inflación estadounidense.
En el gráfico de 5 minutos deberíamos considerar los niveles de 1,0726-1,0733, 1,0797-1,0804, 1,0838-1,0856, 1,0888-1,0896, 1,0940-1,0951, 1,1011, 1,1048, 1,1091, 1,1132-1,1140, 1,1189-1,1191, 1,1275-1,1292. El jueves no hay eventos ni publicaciones importantes programados en la Unión Europea, pero en Estados Unidos se publicará un importante informe sobre la inflación. Aunque su valor será neutro, el mercado puede aprovecharlo para abrir nuevas posiciones.
Reglas básicas del sistema de negociación
1) La fuerza de la señal se considera por el tiempo que tardó en formarse (rebote o superación de un nivel). Cuanto menos tiempo tarde, más fuerte será la señal.
2) Si dos o más operaciones se abrieron cerca de cualquier nivel en señales falsas, todas las señales posteriores de este nivel deben ser ignoradas.
3) En flat, cualquier par puede formar muchas señales falsas o no formarlas en absoluto. Pero en cualquier caso, es mejor dejar de operar a las primeras señales de flat.
4) Las operaciones se abren en el período comprendido entre el inicio de la sesión europea y la mitad de la sesión americana, después de lo cual todas las operaciones deben cerrarse manualmente.
5) Dependiendo de las señales del indicador MACD, en el marco temporal de una hora conviene operar sólo si hay una buena volatilidad y una tendencia confirmada por una línea de tendencia o un canal de tendencia.
6) Si dos niveles están muy cerca el uno del otro (de 5 a 20 pips), deben ser considerados como soporte o resistencia.
7) Cuando se pasan 15 pips en la dirección correcta, se debe colocar un Stop Loss en el punto de equilibrio.
Qué hay en los gráficos:
Los niveles de precios de soporte y resistencia son niveles que son objetivos para la apertura de compras o ventas. En torno a ellos se pueden colocar niveles de Take Profit.
Líneas rojas - canales o líneas de tendencia, que muestran la tendencia actual y en qué dirección es preferible operar ahora.
Indicador MACD(14,22,3) - histograma y línea de señal - un indicador auxiliar que también se puede utilizar como fuente de señales.
Los discursos e informes importantes (siempre incluidos en el calendario de noticias) pueden influir en gran medida en el movimiento de un par de divisas. Por lo tanto, durante su publicación debe operar con la mayor cautela posible o salir del mercado para evitar un brusco cambio del precio en contra del movimiento anterior.
Los principiantes que operan en el mercado de divisas deben recordar que todas las operaciones no pueden ser rentables. Desarrollar una estrategia clara y una gestión del capital es la clave del éxito en las operaciones a largo plazo.