empty
 
 
03.12.2024 03:53 AM
Trading Recommendations and Review of EUR/USD on December 3: A Tough Start to the Week for the Euro

EUR/USD 5-Minute Analysis

This image is no longer relevant

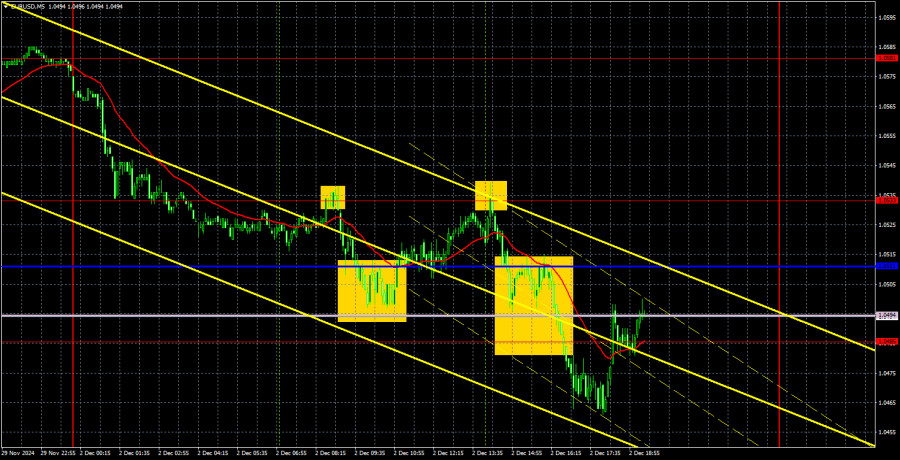
On Monday, the EUR/USD currency pair began to decline immediately. This doesn't necessarily mean that the downward trend will continue throughout the week, as there will be plenty of macroeconomic events. However, Monday's market activity indicated a readiness to resume dollar purchases, with no strong need for an extended correction. Notably, the day's most significant report favored the U.S. currency. While the ISM Manufacturing PMI was below the "waterline" of 50.0, it still exceeded the forecast. However, the dollar started rising earlier in the night, so the ISM index alone cannot be credited for the dollar's gains on Monday.

The price has reached the Senkou Span B line of the Ichimoku indicator. A rebound from this line may trigger a new corrective wave. However, this week, the dollar's dynamics will largely depend on U.S. macroeconomic data. If the data disappoints, the market may sell the dollar temporarily. In the medium term, we still expect the U.S. currency to strengthen.

There were numerous trading signals on Monday due to the price being concentrated in an area with several lines and levels. As a result, any signal was quickly followed by the price reaching another key level or line, making it impractical to enter trades. We believe skipping such ambiguous signals and waiting for clearer ones is better.

COT Report

This image is no longer relevant

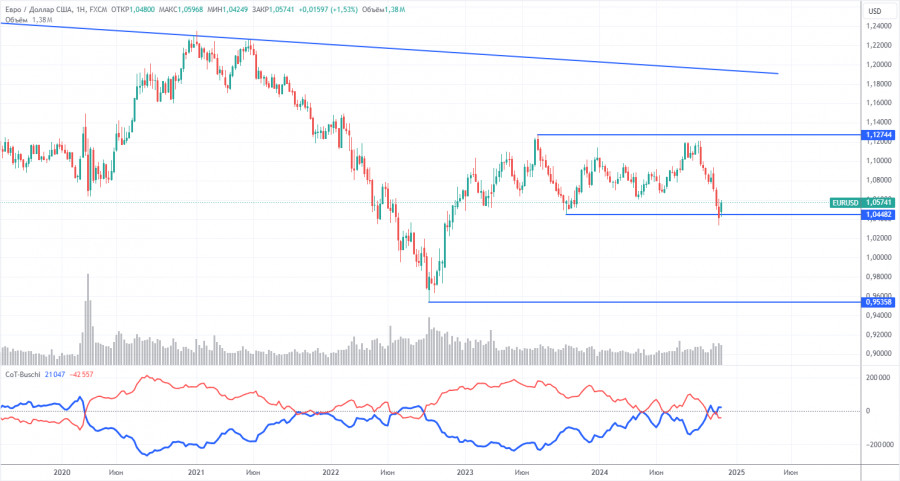
The latest Commitments of Traders (COT) report is dated November 19. The data clearly shows that the net position of non-commercial traders has been bullish for a long time, but the bearish sentiment is gradually gaining strength. A month ago, the number of short positions among professional traders surged, and for the first time in a long time, the net position turned negative. This indicates that the euro is now being sold more frequently than bought.

We continue to see no fundamental factors supporting euro strengthening, and technical analysis points to consolidation—a flat movement. On the weekly timeframe, the pair has been trading between 1.0448 and 1.1274 since December 2022. Thus, further decline remains likely. A break below 1.0448 would open up new space for a downward move.

The red and blue lines have crossed and changed their relative positions. During the last reporting week, the number of long positions in the non-commercial group fell by 5,700, while short positions rose by 29,400, leading to a net position decrease of 35,100.

EUR/USD 1-Hour Analysis

This image is no longer relevant

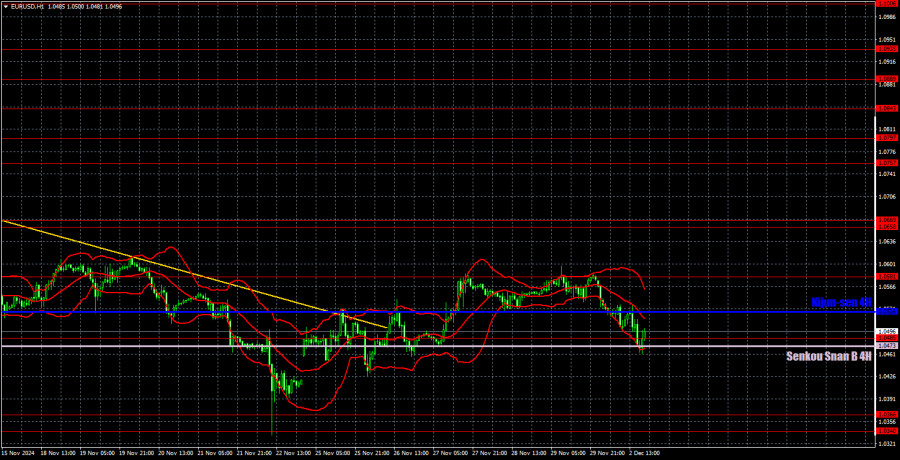
On the hourly timeframe, the pair broke above the descending trendline and began a correction. This correction may be prolonged and slow or short-lived. The macroeconomic backdrop from the U.S. this week will influence market sentiment. We believe there is no basis for significant euro growth, so we await the correction's end and the resumption of the pair's decline toward parity. For example, a break below the Senkou Span B line would signal a possible resumption of the downtrend.

On December 3, we highlight the following levels for trading - 1.0269, 1.0340-1.0366, 1.0485, 1.0581, 1.0658-1.0669, 1.0757, 1.0797, 1.0843, 1.0889, 1.0935, as well as the Senkou Span B (1.0473) and Kijun-sen (1.0526) lines. The Ichimoku indicator lines may shift throughout the day, so this should be accounted for when identifying trading signals. Don't forget to place a Stop Loss at breakeven if the price moves 15 points in the correct direction to protect against potential losses from false signals.

On Tuesday, the most notable macroeconomic data is the JOLTS report on job openings. However, this data is published with a two-month delay, making it less relevant. Market reactions may occur only in the case of a significant deviation from forecasts.

Illustration Explanations:

  • Support and Resistance Levels (thick red lines): Key areas where price movement might stall. Not sources of trading signals.
  • Kijun-sen and Senkou Span B Lines: Ichimoku indicator lines transferred from the H4 timeframe to the hourly chart, serving as strong levels.
  • Extreme Levels (thin red lines): Points where the price has previously rebounded. They can serve as trading signal sources.
  • Yellow Lines: Trendlines, channels, or other technical patterns.
  • Indicator 1 on COT Charts: Reflects the net position size of each trader category.
Gana con los cambios en el valor de las criptomonedas con InstaForex.
Descarga MetaTrader 4 y abre tu primera operación.
  • Grand Choice
    Contest by
    InstaForex
    InstaForex always strives to help you
    fulfill your biggest dreams.
    UNIRSE AL CONCURSO
  • Depósito al azar
    ¡Haga un depósito en su cuenta de $3,000 y obtenga $10000 más!
    ¡En Enero, sorteamos $10000 dentro de la campaña Depósito afortunado!
    Obtenga la oportunidad de ganar depositando $3,000 en una cuenta de operaciones. Tras haber cumplido esta condición, se convertirá en un participante de la campaña.
    UNIRSE AL CONCURSO
  • Opere de forma inteligente, gane un dispositivo
    Recargue su cuenta con al menos $500, regístrese en el concurso y tenga la oportunidad de ganar dispositivos móviles.
    UNIRSE AL CONCURSO
  • 100% de bonificación
    Su oportunidad única de obtener un bono del 100 % en su depósito
    OBTENER BONO
  • 55% de bonificación
    Solicite un bono del 55% en cada depósito
    OBTENER BONO
  • 30% de bonificación
    Reciba un bono del 30% cada vez que recargue su cuenta
    OBTENER BONO

Recommended Stories

¿No puede hablar ahora mismo?
Ingrese su pregunta en el chat.
Widget callback