

signal strength 2 of 5
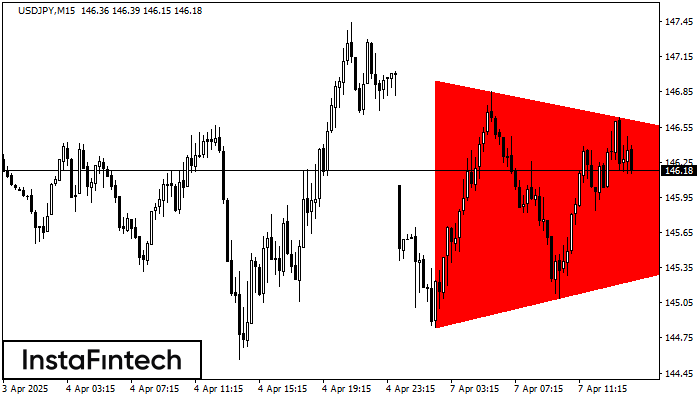
According to the chart of M15, USDJPY formed the Bearish Symmetrical Triangle pattern. Description: The lower border is 144.84/145.98 and upper border is 146.95/145.98. The pattern width is measured on the chart at -211 pips. The formation of the Bearish Symmetrical Triangle pattern evidently signals a continuation of the downward trend. In other words, if the scenario comes true and USDJPY breaches the lower border, the price could continue its move toward 145.76.
The M5 and M15 time frames may have more false entry points.
Vea asimismo
- All
- Double Top
- Flag
- Head and Shoulders
- Pennant
- Rectangle
- Triangle
- Triple top
- All
- #AAPL
- #AMZN
- #Bitcoin
- #EBAY
- #FB
- #GOOG
- #INTC
- #KO
- #MA
- #MCD
- #MSFT
- #NTDOY
- #PEP
- #TSLA
- #TWTR
- AUDCAD
- AUDCHF
- AUDJPY
- AUDUSD
- EURCAD
- EURCHF
- EURGBP
- EURJPY
- EURNZD
- EURRUB
- EURUSD
- GBPAUD
- GBPCHF
- GBPJPY
- GBPUSD
- GOLD
- NZDCAD
- NZDCHF
- NZDJPY
- NZDUSD
- SILVER
- USDCAD
- USDCHF
- USDJPY
- USDRUB
- All
- M5
- M15
- M30
- H1
- D1
- All
- Buy
- Sale
- All
- 1
- 2
- 3
- 4
- 5

El patrón Bandera bajista ha sido formado en el gráfico AUDJPY M15 que señala que la tendencia bajista continuará. Si el precio rompe por debajo del mínimo a 90.01, entonces
Los marcos de tiempo M5 y M15 pueden tener más puntos de entrada falsos.
Open chart in a new window
El patrón Banderín bajista se ha formado en el gráfico AUDJPY M15. El patrón señala la continuación de la tendencia bajista en caso de que se rompa el mínimo
Los marcos de tiempo M5 y M15 pueden tener más puntos de entrada falsos.
Open chart in a new window
El patrón Bandera bajista ha sido formado en USDJPY a M15. El límite inferior del patrón está ubicado en 140.89/141.19 mientras el límite superior se encuentra en 141.19/141.49. La proyección
Los marcos de tiempo M5 y M15 pueden tener más puntos de entrada falsos.
Open chart in a new window


