empty
 
 
13.05.2022: Forex Analysis & Reviews: Trading plan for Ripple on May 13, 2022
loader
Análisis diario de Instaforex - 5 de mayo de 2020
2020-05-05 UTC+3
Análisis diario de InstaForex: 9 de marzo de 2020
2020-03-09 UTC+3
Video análisis técnico Forex | 5 de diciembre de 2017
2017-12-05 UTC+3
Video diario de análisis técnico | 17 de noviembre de 2017
2017-11-17 UTC+3
Video análisis técnico | 15 de noviembre de 2017
2017-11-15 UTC+3
¿Va a caer el AUDJPY? | Análisis técnico Forex Diario | 20 de julio de 2017
2017-07-20 UTC+3
¿USD/CHF listo para un mega rebote? | Análisis técnico diario Forex | 17 de julio 2017
2017-07-17 UTC+3
¡¿Caerá el USD/CHF?! | Análisis Técnico Forex Diario | 14 de July de 2017
2017-07-14 UTC+3
¿Va el EURUSD a despegar? | Video análisis técnico diario | 11 de julio de 2017
2017-07-11 UTC+3
¿Está el GBP/USD preparándose para un buen rebote? | Video análisis técnico diario | 10 de julio de 2017
2017-07-10 UTC+3
¿El AUD va a despegar? | Análisis técnico Forex diario | 6 de julio de 2017
2017-07-06 UTC+3
EUR/USD - todo lo que sube tiene que bajar | Análisis diario de video para el 5 de julio de 2017
2017-07-05 UTC+3
¿Caerá el USD/CHF desde aquídrop from here? | Análisis diario Forex | 4 de julio de 2017
2017-07-04 UTC+3
| EUR/USD | Análisis técnico de video diario para el 23 de junio de 2017
2017-06-23 UTC+3
Video análisis técnico diario | EUR/JPY | 21 de junio de 2017
2017-06-21 UTC+3
Video análisis técnico diario | EUR/USD | 14 de junio de 2017
2017-06-14 UTC+3
| GBP/USD | Análsis técnico de video diario para el 12 de junio de 2017
2017-06-13 UTC+3
Video análisis técnico diario | AUD/JPY | 2 de junio de 2017
2017-06-02 UTC+3

analytics627e634ccc8d1.jpg

Technical outlook:

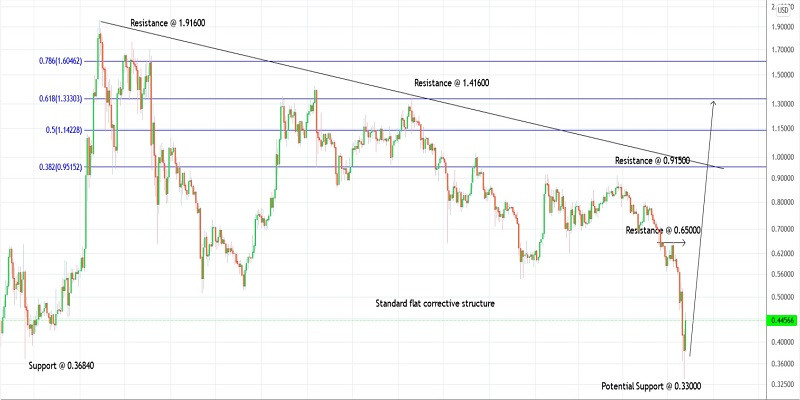
Ripple might have been ale to print a meaningful bottom around the $0.33300 mark, just below its February 2021 low registered around $0.36800 mark. It looks like bulls will be inclined to hold prices above the $0.33300 mark for the next several weeks. Possiblity also remains for a push through all-time highs above the $1.91600 mark.

Ripple is now producing an Engulfing bullish candlestick pattern, in-line with expectations, indicating a potential push towards initial resistance seen around $0.65000 mark. The crypto has raised through $0.46300 mark on Friday and has now eased off slightly through $0.45000 mark at this point in writing. Bulls are looking in control and eyeing above $0.65000 level near term.

Ripple could rally through the Fibonacci 0.618 retracement of the drop between $1.91600 and $0.33300 levels, which is seen through $1.33300 level as projected on the chart here. Since the above drop looks corrective, potential remains for a continued rally through all-time highs above $1.91600 levels going forward.

Trading plan:

Potential rally through $1.33300 against $0.33000

Good luck!

*El análisis de mercado publicado aquí tiene la finalidad de incrementar su conocimiento, más no darle instrucciones para realizar una operación.

  • Grand Choice
    Contest by
    InstaForex
    InstaForex always strives to help you
    fulfill your biggest dreams.
    UNIRSE AL CONCURSO
  • Depósito al azar
    ¡Haga un depósito en su cuenta de $3,000 y obtenga $10000 más!
    ¡En Enero, sorteamos $10000 dentro de la campaña Depósito afortunado!
    Obtenga la oportunidad de ganar depositando $3,000 en una cuenta de operaciones. Tras haber cumplido esta condición, se convertirá en un participante de la campaña.
    UNIRSE AL CONCURSO
  • Opere de forma inteligente, gane un dispositivo
    Recargue su cuenta con al menos $500, regístrese en el concurso y tenga la oportunidad de ganar dispositivos móviles.
    UNIRSE AL CONCURSO
  • 100% de bonificación
    Su oportunidad única de obtener un bono del 100 % en su depósito
    OBTENER BONO
  • 55% de bonificación
    Solicite un bono del 55% en cada depósito
    OBTENER BONO
  • 30% de bonificación
    Reciba un bono del 30% cada vez que recargue su cuenta
    OBTENER BONO
¿No puede hablar ahora mismo?
Ingrese su pregunta en el chat.
Widget callback