empty
25.07.2019 10:38 AM
Trading recommendations for the EURUSD currency pair - placement of trading orders (July 25)

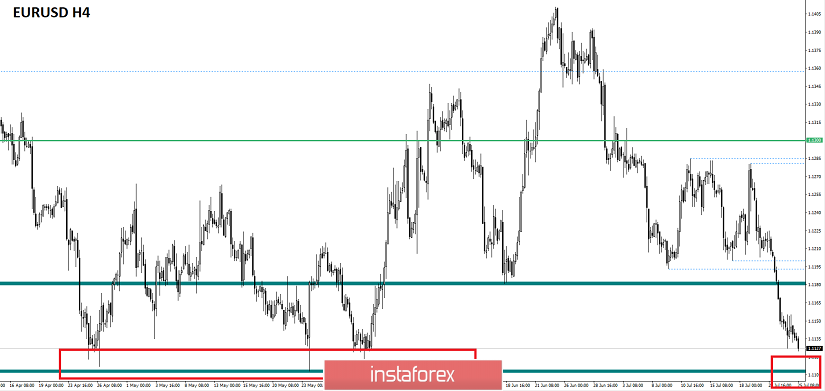
For the last trading day, the euro / dollar currency pair showed an extremely low volatility of 28 points, and as a result, it formed a distinct stagnation in the market. From the point of view of technical analysis, we see that the pulse downward course has given out more than 80 points over the previous days, as a result, closely bringing us to the 1.1100 range, which is the key one in this period of time. As discussed in the previous review, traders switched to insurance mode, holding previously opened short positions. The upcoming meeting of the ECB are forcing fear on market participants and, as a fact, they are pushing for a partial profit taking and moving the stops to breakeven. Considering the trading chart in general terms (daily timeframe), we see a striking picture, the theory of restoring the global downward trend has reached an important price level of 1.1100, against which the court will go in case of its breakdown, as we will instantly find ourselves on 2017 values.

The news background of the past day had a package of statistics on the European Union, which were not so good. The index of business activity in the manufacturing sector fell from 47.6 to 46.4. The index of business activity in the services sector also shows a decline from 53.6 to 53.3. In the United States, data was also coming out, but already regarding sales of new housing, where growth was expected from 626K to 660K, but as a result, the previous data was revised to the worse and in general terms received data: Previous. 604K ---> Act. 646K. The main stumbling block on the news and news background, of course, is the upcoming ECB meeting, which leads to fear of market participants, for this very reason we have seen rapid decline, and the current stagnation. Let's talk more about this fear. In recent days, the noise associated with the speedy decrease in the deposit rate has also been actively raised on the expanses of the world media, as well as such locomotives as experts from Bloomberg, Goldman Sachs, predict horrible things, whipping up fear on traders. Now, let us recall the June meeting and the statement by Mario Draghi - "the eurozone economy needs monetary stimulation, if necessary, the regulator is ready to take appropriate measures."

This image is no longer relevant

Today, the very event that is the focus of attention is the ECB meeting, followed by a press conference. And if no steps in terms of monetary policy occur, the previous drain clearly served to buy euros at a more attractive price. According to statistics, we only have data on the United States regarding durable goods, where they expect a growth of 0.7%, but, most likely, the news will be in the background at the expense of the ECB press conference.

EU 14:45 MSK - interest rate decision

15:30 MSK - ECB Press Conference

Further development

Analyzing the current trading chart, we see that the quotation still weighs within yesterday's stagnation, but nevertheless seeks to come close to the range of 1,1100. Traders, in turn, are divided into two fronts: the first finally closed all previously opened short positions and wait for what will happen next at the time of the ECB meeting; the second part of the traders partially fixed the profit and shifted the restrictive orders with the hope of further descent. It is likely to assume that before the meeting, due to massive fear, we will still be stretched to the side of 1,1100, but then we continue to look at the circumstances and rhetoric of the ECB, as there may be leaps. We do not forget that the quotation is now at important values, and if the level of 1,1100 still falls, then the conversation about the resumption of the global downward trend will sparkle with new colors and we will be on the values of 2017.

This image is no longer relevant

Based on the available information, it is possible to decompose a number of variations, let's consider:

- Positions for the purchase will be considered if the ECB does not say anything special and we will see a support, followed by a surge to the top. Estimated rebound in the direction of 1.1180.

- Positions for sale, as written earlier, already existed and went into the stage of fixation. Now, if we do not have deals, it is better to wait for a clear fixation lower than 1,1100, with the support of the information background.

Indicator Analysis

Analyzing a different sector of timeframes (TF), we see that indicators in the short, intraday and medium term have a downward interest against the general background of the inertial course. It should be understood that at the time of the ECB meeting, indicators on smaller timeframes can jump.

This image is no longer relevant

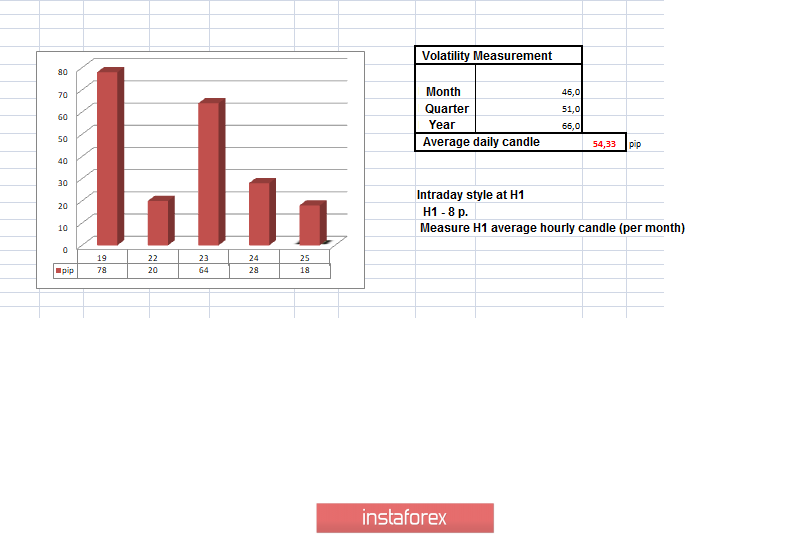
Weekly volatility / Measurement of volatility: Month; Quarter; Year

Measurement of volatility reflects the average daily fluctuation, based on monthly / quarterly / year.

(July 25 was based on the time of publication of the article)

The current time volatility is 18 points. It is likely to assume that due to the upcoming event, volatility may increase, exceeding the daily average. Referring to the previous day and extremely low volatility, it can be assumed that the stagnation will serve to the engine of the current day.

This image is no longer relevant

Key levels

Zones of resistance: 1.1180 *; 1,1300 **; 1.1450; 1.1550; 1.1650 *; 1.1720 **; 1.1850 **; 1.2100

Support areas: 1,1100 **; 1.1000 ***; 1,0850 **

* Periodic level

** Range Level

*** Psychological level

**** The article is based on the principle of conducting a transaction, with daily adjustment.

เลือกช่วงเวลา
5
นาที
15
นาที
30
นาที
1
ชั่วโมง
4
ชั่วโมง
1
วัน
1
สัปดาห์
รับผลกำไรจากการเปลี่ยนแปลงอัตราสกุลเงินดิจิทัลกับ InstaForex.
ดาวน์โหลด MetaTrader 4 และเปิดการซื้อขายครั้งแรกของคุณ.
  • Chancy Deposit
    ฝากเงินในบัญชีของคุณใน $3,000 และรับ $8000 ไปเพิ่ม!
    ใน มีนาคม ทางเราได้ออก$8000 ภายในแคมเปญ Chancy Deposit !
    คว้าโอกาสที่จะชนะด้วยการฝากเงิน $3,000 ไปในบัญชีเทรด เมื่อทำตามเงื่อนไขนี้แล้ว คุณก็จะกลายเป็นผู้เข้าร่วมแคมเปญ
    เข้าร่วมการแข่งขัน


บทความแนะนำ

สัญญาณการซื้อขายสำหรับทองคำ (XAU/USD) สำหรับวันที่ 28-31 มีนาคม 2025: ขายต่ำกว่า $3,078 (การปรับฐานทางเทคนิค - 21 SMA)

ในช่วงแรกของการซื้อขายในสหรัฐฯ ราคาทองคำอยู่ที่ประมาณ 3,078 ซึ่งต่ำกว่าสถิติสูงสุดใหม่ที่ประมาณ 3,086 ซึ่งเคยเกิดขึ้นในช่วงการซื้อขายในยุโรป ทองคำยังคงมีโมเมนตัมเชิงบวก อย่างไรก็ตาม อาจเผชิญกับการปรับฐานทางเทคนิคในชั่วโมงข้างหน้า หากราคาคงที่ต่ำกว่า 3,078 แนวรับสำคัญอยู่ที่บริเวณเส้นเฉลี่ยเคลื่อนที่ 21 SMA ที่

Dimitrios Zappas 14:12 2025-03-28 UTC+2

สัญญาณการเทรดสำหรับ EUR/USD วันที่ 28-31 มีนาคม 2025: ขายต่ำกว่า 1.0775 (21 SMA - 6/8 Murray)

ในช่วงต้นของการซื้อขายในสหรัฐอเมริกา ยูโรซื้อขายอยู่ที่ประมาณ 1.0771 ต่ำกว่า 21SMA และภายในช่องแนวโน้มขาลงที่เกิดขึ้นตั้งแต่วันที่ 14 มีนาคม ทิศทางมีแนวโน้มขาลง เมื่อวานนี้ EUR/USD พยายามที่จะทะลุช่องแนวโน้มขาลงและขึ้นเหนือ 1.0830 แต่ไม่สามารถยืนรักษาความแข็งแกร่งขาขึ้นได้ ขณะนี้เราสังเกตเห็นว่าการเคลื่อนไหวในแนวขาลงยังคงดำเนินต่อไป

Dimitrios Zappas 14:09 2025-03-28 UTC+2

EUR/USD. วันที่ 28 มีนาคม ฝ่ายหมีถอย แต่ยังไม่ยอมแพ้

ในวันพฤหัสบดี คู่เงิน EUR/USD ดีดตัวขึ้นจากระดับ Fibonacci retracement 161.8% ที่ 1.0734 และขึ้นไปถึงโซนต้านทานที่ 1.0781–1.0797 การดีดตัวจากโซนนี้จะเป็นประโยชน์ต่อเงินดอลลาร์สหรัฐและนำไปสู่การลดลงไปยังระดับ 1.0734 อีกครั้ง การฝ่าและสร้างความมั่นคงเหนือโซนนี้จะเปิดโอกาสให้เงินยูโรดันขึ้นต่อไปยังระดับ

Samir Klishi 10:48 2025-03-28 UTC+2

GBP/USD. 28 มีนาคม ผลลัพธ์ที่น่าผิดหวังจากเศรษฐกิจของอังกฤษ

บนกราฟรายชั่วโมง คู่สกุลเงิน GBP/USD ในวันพฤหัสบดีได้ฟื้นตัวจากระดับ 1.2865 กลับทิศทางในความโปรดปรานของปอนด์ และได้ขึ้นเหนือระดับ 1.2931 ซึ่งไม่มีความสำคัญภายใต้สถานการณ์ตลาดที่แนวระนาบ วันนี้ การเคลื่อนที่ขึ้นยังคงดำเนินต่อไปสู่ระดับ Fibonacci 127.2% ที่ 1.3003

Samir Klishi 10:36 2025-03-28 UTC+2

EUR/USD และ GBP/USD วันที่ 28 มีนาคม – การวิเคราะห์ทางเทคนิค

เมื่อสัปดาห์ใกล้จะสิ้นสุดลง ตลาดยังคงไม่มีความชัดเจนในการตัดสินใจ ไม่มีทิศทางที่ชัดเจนให้เห็น เมื่อวานนี้ ฝ่ายกระทิงได้ทำการปรับเปลี่ยนมุมมองแนวราบซึ่งมีมาโดยทั่วไปเล็กน้อย เพื่อยืนยันและรวมผลให้มั่นคงยิ่งขึ้น พวกเขาจำเป็นต้องข้ามกลุ่มระดับแนวต้านจากหลายกรอบเวลาในช่วง 1.0819–1.0856 หลังจากนั้น โอกาสใหม่สำหรับการเติบโตต่อไปรออยู่ โดยมีเป้าหมายถัดไปคือขอบเขตบนของเมฆ Ichimoku ในกรอบรายสัปดาห์ (1.0953) และรายเดือน

Evangelos Poulakis 09:09 2025-03-28 UTC+2

การคาดการณ์คู่เงิน EUR/USD สำหรับวันที่ 28 มีนาคม 2025

รายงานทางเศรษฐกิจสำคัญเมื่อวาน—U.S. Q4 GDP—รายงานออกมาที่ 2.4% เทียบกับที่คาดการณ์ไว้ 2.3% อย่างไรก็ตาม สำนักสำคัญสามแห่ง—Moody's, Fitch Ratings, และ S&P Global—ได้เตือนถึงความเสี่ยงที่เศรษฐกิจอาจถดถอยจากการเก็บภาษีนำเข้าที่เข้มงวด และสำนักงานงบประมาณรัฐสภาได้ปรับลดการคาดการณ์การเติบโตของปีปัจจุบันลงเหลือ 1.9%

Laurie Bailey 04:01 2025-03-28 UTC+2

การทำนายค่าเงิน GBP/USD สำหรับวันที่ 28 มีนาคม 2025

แม้ว่าข้อมูลจากสหรัฐฯ จะแสดงให้เห็นถึงการเติบโตที่ 2.4% ซึ่งสูงกว่าที่คาดการณ์ไว้ที่ 2.3% แต่ดัชนีดอลลาร์กลับลดลง 0.28% ด้วยเหตุนี้เงินปอนด์จึงพุ่งขึ้น 78 pips เกือบแตะที่เป้าหมาย 1.3001 ตัวชี้วัด Marlin ในกรอบเวลารายวันกลับมาอยู่ในพื้นที่บวก

Laurie Bailey 04:01 2025-03-28 UTC+2

การพยากรณ์ USD/JPY สำหรับวันที่ 28 มีนาคม 2025

เมื่อวานนี้ Donald Trump ได้ลงนามในคำสั่งฝ่ายบริหารให้กำหนดภาษี 25% สำหรับยานยนต์และชิ้นส่วนยานยนต์ที่นำเข้าไปยังสหรัฐอเมริกา ภาษีสำหรับยานยนต์จะเริ่มมีผลบังคับใช้ในวันที่ 3 เมษายน และสำหรับชิ้นส่วนจะเริ่มในวันที่ 3 พฤษภาคม หลังจากมีข่าวนี้ ค่าเงินเยนอ่อนตัวลง 0.18%

Laurie Bailey 04:01 2025-03-28 UTC+2

สัญญาณการซื้อขายสำหรับคู่เงิน EUR/USD ระหว่างวันที่ 27-29 มีนาคม 2025: ซื้อเมื่อเหนือระดับ 1.0790 (21 SMA - 8/8 Murray)

หากค่าเงินยูโรยังคงฟื้นตัวและสามารถยืนเหนือระดับ 1.0790 ในชั่วโมงถัดไปได้ เราอาจคาดว่า EUR/USD จะยังคงปรับตัวขึ้นต่อไปได้ ดังนั้นเครื่องมือการเงินนี้อาจแตะที่ +2/8 มาร์เรย์ ที่ระดับ 1.0986 ในระยะสั้น และอาจถึงระดับจิตวิทยาที่ 1.10 ด้วย

Dimitrios Zappas 13:55 2025-03-27 UTC+2

สัญญาณการเทรดสำหรับ GOLD (XAU/USD) วันที่ 27-29 มีนาคม 2025: ขายต่ำกว่า $3,057 (ดับเบิลท็อป - 7/8 Murray)

ในช่วงเริ่มต้นของเซสชั่นอเมริกา ราคาทองคำซื้อขายอยู่ที่ประมาณ 3,051 และสูงกว่าระดับ 7/8 ของ Murray โดยมีการขึ้นสูงสุดตลอดกาลที่ 3,057 ทองคำอาจพยายามทะลุระดับสูงที่เคยถึงเมื่อวันที่ 18 มีนาคม หากราคาสามารถยืนเหนือระดับ 7/8

Dimitrios Zappas 13:54 2025-03-27 UTC+2
หากไม่สะดวกคุยในตอนนี้
ระบุคำถามไว้ได้ใน แชท.
Widget callback
 

Dear visitor,

Your IP address shows that you are currently located in the USA. If you are a resident of the United States, you are prohibited from using the services of InstaFintech Group including online trading, online transfers, deposit/withdrawal of funds, etc.

If you think you are seeing this message by mistake and your location is not the US, kindly proceed to the website. Otherwise, you must leave the website in order to comply with government restrictions.

Why does your IP address show your location as the USA?

  • - you are using a VPN provided by a hosting company based in the United States;
  • - your IP does not have proper WHOIS records;
  • - an error occurred in the WHOIS geolocation database.

Please confirm whether you are a US resident or not by clicking the relevant button below. If you choose the wrong option, being a US resident, you will not be able to open an account with InstaForex anyway.

We are sorry for any inconvenience caused by this message.