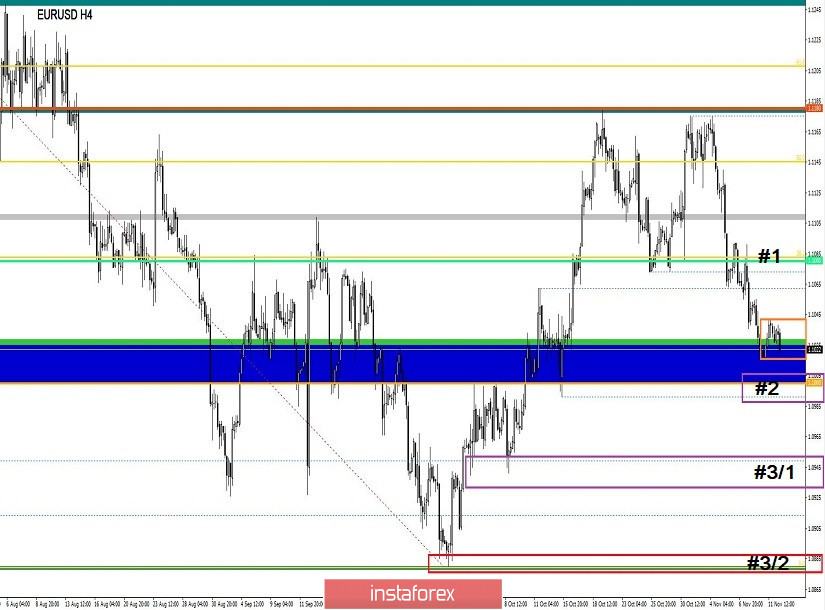
The quotation froze within the control point # 2, what can the slowdown lead to and is there a chance to see step # 3? – we will analyze these issues in our article.
From technical analysis, we see a slight pullback from the fulcrum in the face of the psychological level of 1.1000, where without any dynamics, the quote took a wait-and-see position. The recovery phase #2 has almost reached its benchmark level of 1.1000, where market participants received a subsequent signal of a possible move since relative to the entire value of the oblong correction, we received 54% of the working off, which is already the norm of recovery. In terms of volatility, there was a downturn yesterday, which reflected a clear restraint and lack of buyers. Whether this can be considered a signal of the upcoming breakdown at the level of 1.1000 will show time, which is more interesting to me, is this correlation ratio between the EURUSD and GBPUSD pairs. So last day for the pound/dollar pair was expressed in the form of an upward momentum of 118 points, against the background of the information flow, but at the same time, such a close pair on the market of the euro/dollar did not repeat the move. Yes, I understand that this news, on which the pound jumped, is purely inside the British noise, but from technology and correlation, a pattern could play, but it was not. Thus, the question is, the correlation between the pairs has fallen strongly or is it a short number of short positions in phase # 2, which simply does not make it possible to fully unfold.
Analyzing the past day hourly, we will encounter a narrow corridor of 17-18 points, which came to replace the rollback. As you understand, no impulses, jumps, were recorded in this period.
As discussed in the previous review, traders actively began to consider closing short positions, from the point of view that a rebound from the support of 1.1000 is still possible and the risk of loss of profits is great. This decision was not unanimous and many traders continued to hold short positions while considering topping up outside the control point.
Looking at the trading chart in general terms (the daily period), we see the second phase of the recovery relative to the oblong correction, where 132 points remain to go to the fulcrum of the current year. Let me remind you that currently, the trend for the euro/dollar pair is downward. The point of the trend report is from February 2018. The global trend, counting from July 2008.
The news background of the last day did not have statistical data, in addition to everything, the United States had a day off, celebrated "Veterans Day", which also affected trading volumes and volatility.
The information background was practically absent, so the US-China relations were again discussed on the sidelines, outside the cameras of the media, thus we have a temporary silence in this direction. The Brexit divorce proceedings are now in the background since Britain is busy with the parliamentary elections, and before them, there will be no discussion/approval of the transaction.
Today, in terms of the economic calendar, we do not have statistics for Europe and the United States again. The only thing we have is the speech of US President Donald Trump in the "New York Economic Club", the theme of the speech will be the economy and trade. At the same time, there was a rumor from the media in the face of the American edition of Politico that Trump will make an important announcement this week on biteable duties on cars from the European Union. Referring to the source, the American leader plans to postpone input for six months. Let me remind you that back in May of this year there was not a small noise regarding possible duties from the USA and the EU, where some wanted to increase duties by 25% for European cars, while others threatened with mirror measures in the form of additional duties of € 35 billion for American goods.
Further development
Analyzing the current trading chart, we continue to observe a rather sluggish oscillation within the same psychological level of 1.1000. Stage #2 continues its formation, oscillating near the reference point of support, where the desire of sellers is dominated by the volume of buyers. In terms of volatility, there is a characteristic decline, but it is due to the fulcrum and indecision in terms of the transition steps #2 – #3. The emotional component of the market confirms the dynamics of volatility, in terms of indecision, and perhaps even a kind of readiness, which is expressed in the regrouping of trading forces.
By detailing the available time interval, we see all the same narrow fluctuation within 18 points, where this time we have a transition not from a rollback to stagnation, but from stagnation to recovery.
In turn, some traders, because of insurance, nevertheless leave previously open short positions, which is probably the right step, but at the same time, if you operate with moderate money management, you can continue to work in the existing transaction, also considering locally – alternative positions.
It is likely to assume that the general downward mood will remain in the market, where the priority is in the form of distribution of trading forces within 1.1015/1.1040. That is, in the case of a flight lower than 1.1015, the probability of breaking the psychological mark of 1.1000 will be great, but at the same time, it is possible to repeat the plot of the breakdown of the level of 1.1080, where there were multiple approaches, before the main movement. An alternative scenario is considered in the case of restraining trading forces and working off the level of 1.1000, where the market entry is considered in the area of 1.1045-1.1055.
Based on the above information, we derive trading recommendations:
- Buy positions are considered if the price goes to the area of 1.1045-1.1055.
- Sales positions are held in the direction of the level of 1.1000, followed by prolongation in the direction of 1.0950 (variable level), and the main finishing stage of recovery of 1.0880.
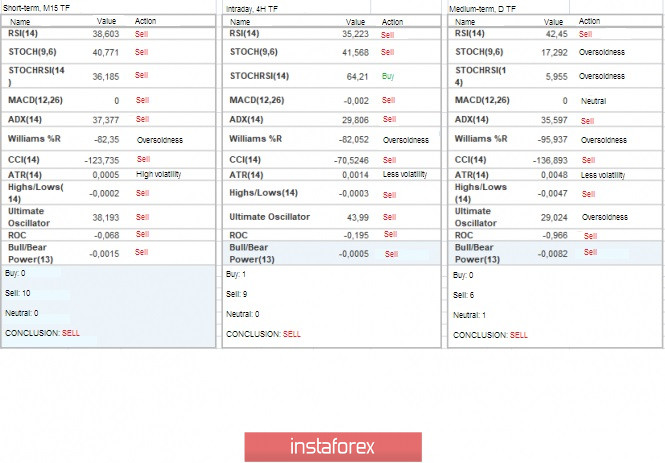
Indicator analysis
Analyzing different sectors of timeframes (TF), we see that the indicators in all major time intervals signal the prevailing downward interest. It is worth considering that the indicators in the short-term interval are a good indicator, due to the characteristic stagnation.
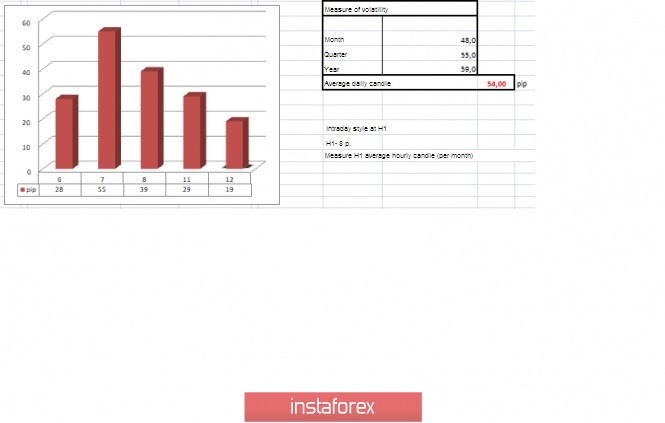
Volatility per week / Measurement of volatility: Month; Quarter; Year.
Measurement of volatility reflects the average daily fluctuation, calculated for the Month / Quarter / Year.
( November 12 was built taking into account the time of publication of the article)
The volatility of the current time is 19 points, which is a low indicator for this period. It is likely to assume that in the event of a breakdown of the main fulcrum, an acceleration of volatility is possible. If the chatter along the psychological level persists, then the volatility will not change.
Key levels
Resistance zones: 1.1080**; 1.1180* ; 1.1300**; 1.1450; 1.1550; 1.1650*; 1.1720**; 1.1850**; 1.2100.
Support zones: 1.1000***; 1.0900/1.0950**;1.0850**; 1.0500***; 1.0350**; 1.0000***.
* Periodic level
** Range level
*** Psychological level
***** The article is based on the principle of conducting transactions, with daily adjustments.