empty
25.09.2020 11:01 AM
Trading recommendations for GBPUSD pair on September 25

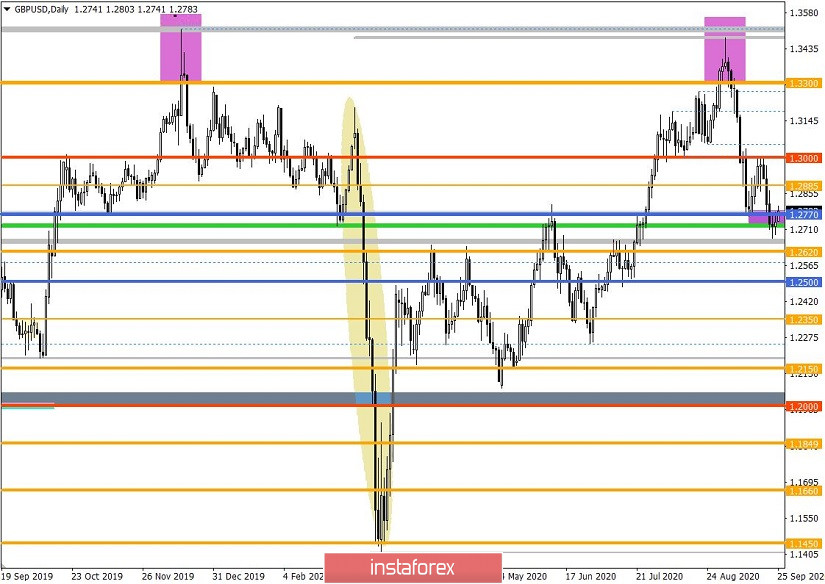
Yesterday, the GBP/USD pair continued to concentrate on the variable range 1.2674/1.2775, confirming the fact that the price was consolidating below the support level of 1.2770. A consistent decline indicates a change in the price trend in the medium term, and even if the variable amplitude enters a correction stage, this will not be the end for the downward development.

Now, we should take about the pound's impressive decline in the period of 1-2 months, where the weakening by 800 points is only half of the possible move. The scale is large, but we should not forget that the market is highly susceptible to the information background, where local price surges may occur depending on the incoming information on COVID and Brexit. Thus, even if there are signals about a changing trend, we should not forget that a local approach to trading positions in 2020 is considered the most significant on the market.

A local operation means staying in a position for 1-2 days with a following change in the algorithm, depending on the market situation.

Analyzing yesterday's fifteen-minute TF, you can see that the quote has been moving within the range of 1.2674/1.2775 for as long as 48 hours, which indicates the process of regrouping trade forces at new price levels.

In terms of daily dynamics, the activity slowed down by 27% relative to the average level, which is confirmed by the stage of price consolidation in a variable amplitude. We can confidently say that it is a local slowdown, and we will see another surge in the market soon.

As discussed in the previous review, further declines are considered in the market even if the current amplitude turns into a correction.

Looking at the trading chart in general terms (daily period), you can see a slight resemblance to the March collapse, but not really since the rate of price change is even lower compared to the example above.

This image is no longer relevant

Previous news background included weekly data on applications for unemployment benefits in the US, where growth is recorded instead of decline in volume. Moreover, primary applications rose from 866,000 to 870,000, where the previous data was revised downward from 860,000 to 866,000. In turn, repeated applications fell from 12,747,000 to 12,580,000, but their decline was predicted to 12,339,000. At the same time, the previous data was revised downward from 12,628,000 to 12,747,000.

The market reaction to the statistics was ignored.

In terms of the information background, everyone is worried about the second wave of COVID-19, where the UK sets records for the daily increase in new cases for the second day in a row. The global cases are growing insatiably, but restrictive measures have so far been reintroduced only in a number of countries. The main question is whether the restrictions will be fully deployed, since this will directly affect the economy. So, the risk of repeating the March collapse remains in the market.

In terms of the economic calendar, we have data today on orders for durable goods in the United States, where they forecast an increase of 1.5% in August.

The upcoming trading week is expected to be filled with events in terms of statistics (see the list below). An additional incentive for speculators is the endless information background related to the coronavirus and the Brexit divorce proceedings.

[All time zones are in Universal Time]

Tuesday, September 29

UK Lending Market - 8:30 UTC+00

- Volume of consumer lending by the Bank of England (August)

- Number of approved mortgages (August)

- Volume of mortgage lending (August)

USA 13:00 - S & P/CaseShiller House Price Index for July.

Wednesday, September 30

UK 6:00 - GDP (Q2)

USA 12:15 - ADP report on employment in the private sector, for September

USA 12:30 Moscow time - - GDP (Q2)

Thursday October 1st

USA 12:30 Moscow time - Claims for unemployment benefits

Friday, October 2

USA 12:30 - report of the US Department of Labor

- Change in the number of people employed in the non-agricultural sector

- Unemployment rate

- Average hourly wages

Further development

Analyzing the current trading chart, we can see a local surge of activity relative to the boundaries of the previously set amplitude, but with the current market situation, even a corrective move will not change much. A price consolidation below 1.2700 has already been noticed, and the set decline from September 1 continues to be the focus of interest of the market.

The prospect of developing short positions is really great, but first you need to complete the stage of regrouping trading forces, which is expressed in the amplitude of 1.2674/1.2775 and the current impulse.

If the expectations for the downward development coincide, a movement in the direction of the 1.2000 level in the near future will be expected.
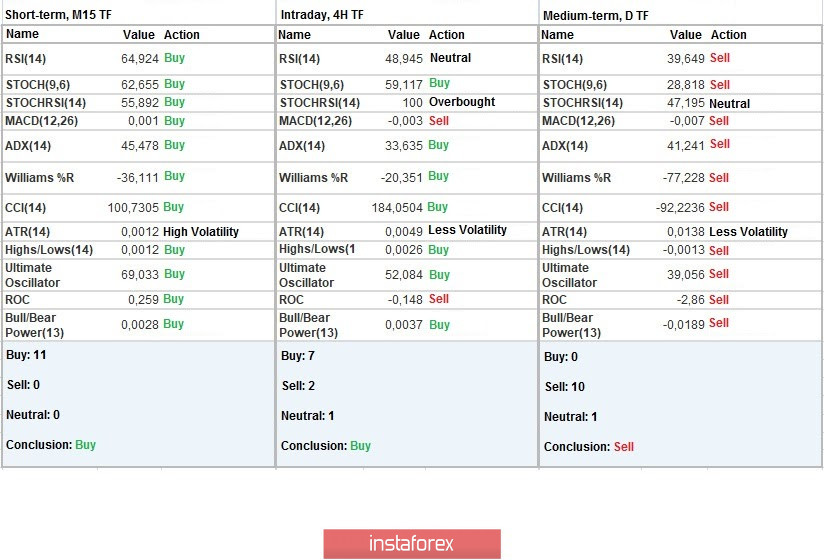
This image is no longer relevant

Indicator analysis

Analyzing different sectors of time frames (TF), the indicators of technical tools on minute and hourly time frames signal a buy due to a local surge of long positions. The daily TF, as before, signals a sell, focusing on the renewal of local lows.

This image is no longer relevant

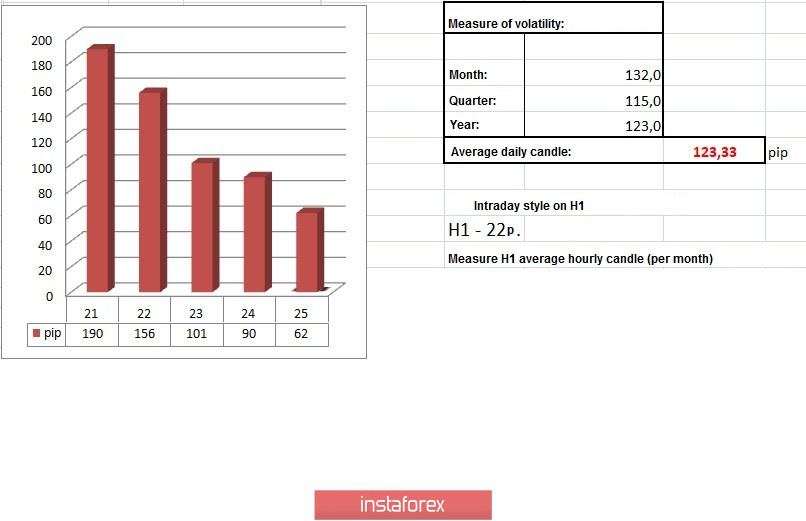
Weekly volatility / Volatility measurement: Month; Quarter; Year

Measurement of volatility reflects the average daily fluctuation, calculated per Month / Quarter / Year.

(It was built considering the time of publication of the article)

The volatility of the current time is 62 points, which is 49% below the average. It can be assumed that the speculative excitement will try to disperse the market even at the stage of regrouping of trade forces.

This image is no longer relevant

Key levels

Resistance zones: 1.2885 *; 1.3000 ***; 1.3200; 1.3300 **; 1.3600; 1.3850; 1.4000 ***; 1.4350 **.

Support zones: 1.2770 **; 1.2620; 1.2500; 1.2350 **; 1.2250; 1.2150 **; 1.2000 *** (1.1957); 1.1850; 1.1660; 1.1450 (1.1411).

* Periodic level

** Range level

*** Psychological level

Summary
Urgency
Analytic
Vladislav Tukhmenev
Start trade
รับผลกำไรจากการเปลี่ยนแปลงอัตราสกุลเงินดิจิทัลกับ InstaForex.
ดาวน์โหลด MetaTrader 4 และเปิดการซื้อขายครั้งแรกของคุณ.
ภาพรวมของ EUR/USD – วันที่ 25 กรกฎาคม: การประชุม ECB ไม่ได้เปลี่ยนแปลงความแรงระหว่างดอลลาร์และยูโร คู่สกุลเงิน EUR/USD ยังคงเคลื่อนไหวขาขึ้นในวันพฤหัสบดี มีเหตุการณ์ทางเศรษฐกิจมหภาคหลายเหตุการณ์ที่จัดขึ้นในวันนั้น และสิ่งเหล่านี้ก่อให้เกิดการตอบสนองของตลาดเพียงเล็กน้อยตามที่เราได้คาดการณ์ไว้ อย่างไรก็ตาม ใครจะสนเรื่องการเคลื่อนไหวเพียง 20-30 จุดในขั้นตอนนี้เล่า? ก่อนที่ผลการประชุมของธนาคารกลางยุโรปจะถูกประกาศออกมา และแม้ว่าจะมีการเผยแพร่ดัชนีกิจกรรมทางธุรกิจถึงหกตัว ความผันผวนของคู่สกุลเงินก็อยู่เพียง 38 จุด เท่านั้น
  • Chancy Deposit
    ฝากเงินในบัญชีของคุณใน $3,000 และรับ $4000 ไปเพิ่ม!
    ใน กรกฎาคม ทางเราได้ออก$4000 ภายในแคมเปญ Chancy Deposit !
    คว้าโอกาสที่จะชนะด้วยการฝากเงิน $3,000 ไปในบัญชีเทรด เมื่อทำตามเงื่อนไขนี้แล้ว คุณก็จะกลายเป็นผู้เข้าร่วมแคมเปญ
    เข้าร่วมการแข่งขัน


บทความแนะนำ

การพยากรณ์ฟอเร็กซ์วันที่ 24/07/2025: EUR/USD, GBP/USD, ทองคำ, Ethereum และ Bitcoin

ลิงก์ที่มีประโยชน์: บทความอื่นๆ ของฉันสามารถอ่านได้ในส่วนนี้ หลักสูตร InstaForex สำหรับผู้เริ่มต้น การวิเคราะห์ยอดนิยม เปิดบัญชีซื้อขาย สำคัญ: มือใหม่ในการเทรดฟอเรกซ์ควรระมัดระวังอย่างมากในการตัดสินใจเข้าสู่ตลาด ก่อนการประกาศรายงานที่สำคัญ ควรหลีกเลี่ยงการเข้าสู่ตลาดเพื่อป้องกันการเผชิญกับความผันผวนที่รุนแรงซึ่งเกิดจากความผันผวนที่เพิ่มขึ้น หากคุณตัดสินใจที่จะเทรดในช่วงที่มีการประกาศข่าว ควรวางคำสั่งหยุดการขาดทุนเสมอเพื่อช่วยลดการสูญเสีย หากไม่วางคำสั่งหยุดการขาดทุน

Sebastian Seliga 12:02 2025-07-24 UTC+2

การพยากรณ์สำหรับ EUR/USD ในวันที่ 24 กรกฎาคม 2025

เมื่อวันพุธ คู่สกุลเงิน EUR/USD ได้ดีดตัวขึ้นจากระดับการถอยหลังกลับของ Fibonacci ที่ 127.2% ที่ 1.1712 มีการกลับตัวที่เป็นผลดีกับเงินยูโร และยังคงปรับตัวขึ้นต่อเนื่องสู่ระดับ 1.1802 หากมีการดีดตัวจาก 1.1802 จะเป็นผลดีกับดอลลาร์สหรัฐและทำให้มีการถอยเล็กน้อยไปยัง

Samir Klishi 11:21 2025-07-24 UTC+2

คาดการณ์ GBP/USD สำหรับวันที่ 24 กรกฎาคม 2025

ในกราฟรายชั่วโมง คู่สกุลเงิน GBP/USD ได้รวมตัวเหนือระดับการถอยกลับ Fibonacci 61.8% ที่ 1.3530 ในวันพุธ และปรับตัวขึ้นไปถึงระดับ 50.0% ที่ 1.3579 วันนี้ หากเกิดการเด้งกลับจากระดับนี้จะสนับสนุนดอลลาร์สหรัฐ

Samir Klishi 11:05 2025-07-24 UTC+2

สัญญาณการซื้อขายสำหรับ BITCOIN ประจำวันที่ 24-27 กรกฎาคม 2025: ซื้อเมื่อราคาสูงกว่า $117,000 (6/8 Murray - 21 SMA)

บิทคอยน์กำลังซื้อขายสูงกว่าระดับแนวต้านที่แข็งแกร่งที่เส้น 6/8 ของ Murray ซึ่งอาจเป็นสัญญาณถึงการเคลื่อนไหวในแนวโน้มขาขึ้นต่อไปในอีกไม่กี่วันข้างหน้า โดยอาจจะถึงเส้น 7/8 ของ Murray ประมาณ $121,875 หากบิทคอยน์สามารถยืนเหนือ 21SMA ประมาณ $118,000

Dimitrios Zappas 06:25 2025-07-24 UTC+2

สัญญาณการซื้อขายสำหรับทองคำ (XAU/USD) ระหว่างวันที่ 24-27 กรกฎาคม 2025: ขายเมื่อราคาต่ำกว่า $3,400 (21 SMA - 7/8 Murray)

อย่างที่เราได้กล่าวไว้เมื่อวานนี้ในการวิเคราะห์ของเรา ทองคำได้พักจากการเพิ่มขึ้นอย่างรุนแรงหลังจากไปถึงแนวต้านที่แข็งแกร่งและอยู่ในระดับที่ซื้อมากเกินไป หลังจากการปรับฐานทางเทคนิคต่ำกว่า 3,437 ทองคำก็ลดลงอย่างรวดเร็วไปอยู่ที่ระดับ 3,380 หลังจากที่ไปถึง 8/8 Murray รอบๆ 3,437 ทองคำไม่สามารถประคองตัวเหนือบริเวณนี้ได้ ซึ่งส่งผลให้เกิดการปรับตัวทางเทคนิคคมระหว่างการซื้อขายของอเมริกาเมื่อวานนี้ ตอนนี้คาดว่าจะยังคงลดลงในวันต่อๆ

Dimitrios Zappas 06:23 2025-07-24 UTC+2

สัญญาณการซื้อขาย EUR/USD สำหรับวันที่ 24-27 กรกฎาคม 2025: ซื้อเมื่อราคาสูงกว่า 1.1745 (21 SMA - 8/8 Murray)

ในช่วงต้นของการซื้อขายในยุโรป เงินยูโรซื้อขายที่ประมาณ 1.1772 โดยมีแนวโน้มเชิงบวก ดังนั้น เราเชื่อว่าหากราคายืนเหนือ 1.1718 ได้อย่างมั่นคง มันอาจยังคงขึ้นต่อไปในอีกไม่กี่วันข้างหน้า โดยอาจถึง +1/8 Murray ประมาณ 1.18.40 เงินยูโรอยู่ในแนวโน้มขาขึ้น

Dimitrios Zappas 06:18 2025-07-24 UTC+2

หากระดับการสนับสนุนที่ 6327.24 ในดัชนี S&P 500 สามารถทนต่อการปรับตัวลงในวันนี้ได้ จะส่งผลให้เกิดการแข็งค่าใหม่อีกครั้ง วันพฤหัสบดีที่ 24 กรกฎาคม 2025

ดัชนี S&P 500 – วันพฤหัสบดีที่ 24 กรกฎาคม 2025 เมื่อ EMA(50) รูปแบบ Golden Cross อยู่เหนือ EMA(200)

Arief Makmur 05:54 2025-07-24 UTC+2

แม้ว่าผู้ซื้อยังคงมีบทบาทสำคัญในดัชนี Nasdaq 100 แต่วันนี้, วันพฤหัสบดีที่ 24 กรกฎาคม 2025 อาจมีแนวโน้มที่จะปรับฐานลงได้

ดัชนี Nasdaq 100 – วันพฤหัสบดีที่ 24 กรกฎาคม 2025 จากการเปิดเผยของความแตกต่างระหว่างการเคลื่อนไหวของราคาดัชนี Nasdaq 100 และตัวชี้วัด RSI(14) บ่งชี้ว่า #NDX

Arief Makmur 05:53 2025-07-24 UTC+2

การคาดการณ์ EUR/USD สำหรับวันที่ 24 กรกฎาคม 2025

ท่ามกลางความหวังในตลาดหุ้นที่ถูกขับเคลื่อนด้วยข้อตกลงทางการค้าระหว่างสหรัฐฯ–ญี่ปุ่น ดัชนีดอลลาร์ลดลง 0.18% เมื่อวานนี้ ในขณะที่ยูโรปรับตัวเพิ่มขึ้น 0.16% (16 pips) ขณะนี้ราคามีการรวมบนเส้น MACD ซึ่งเปิดโอกาสให้ยูโรมุ่งเป้าไปที่ขอบบนของช่องราคาที่ 1.1834 อย่างไรก็ตาม เรายังต้องระมัดระวัง เนื่องจากออสซิลเลเตอร์

Laurie Bailey 05:18 2025-07-24 UTC+2

การคาดการณ์สำหรับ GBP/USD ประจำวันที่ 24 กรกฎาคม 2025

ท่ามกลางความเชื่อมั่นในตลาดโดยรวม (S&P 500 +0.78%) ค่าเงินปอนด์อังกฤษเพิ่มขึ้น 48 pips เมื่อวานนี้ ซึ่งเพียงพอให้ตัววัด Marlin oscillator ในกราฟรายวันเคลื่อนเข้าสู่แดนบวก ตอนนี้ราคาอาจไปถึงระดับเป้าหมายที่ 1.3635 และพยายามขยับเข้าใกล้เส้น

Laurie Bailey 05:18 2025-07-24 UTC+2
หากไม่สะดวกคุยในตอนนี้
ระบุคำถามไว้ได้ใน แชท.
Widget callback
 

Dear visitor,

Your IP address shows that you are currently located in the USA. If you are a resident of the United States, you are prohibited from using the services of InstaFintech Group including online trading, online transfers, deposit/withdrawal of funds, etc.

If you think you are seeing this message by mistake and your location is not the US, kindly proceed to the website. Otherwise, you must leave the website in order to comply with government restrictions.

Why does your IP address show your location as the USA?

  • - you are using a VPN provided by a hosting company based in the United States;
  • - your IP does not have proper WHOIS records;
  • - an error occurred in the WHOIS geolocation database.

Please confirm whether you are a US resident or not by clicking the relevant button below. If you choose the wrong option, being a US resident, you will not be able to open an account with InstaForex anyway.

We are sorry for any inconvenience caused by this message.