empty
12.10.2021 04:48 AM
Forecast and trading signals for GBP/USD for October 12. Detailed analysis of the movement of the pair and trade deals. The pound has not decided on the direction of movement on Monday

GBP/USD 5M

This image is no longer relevant

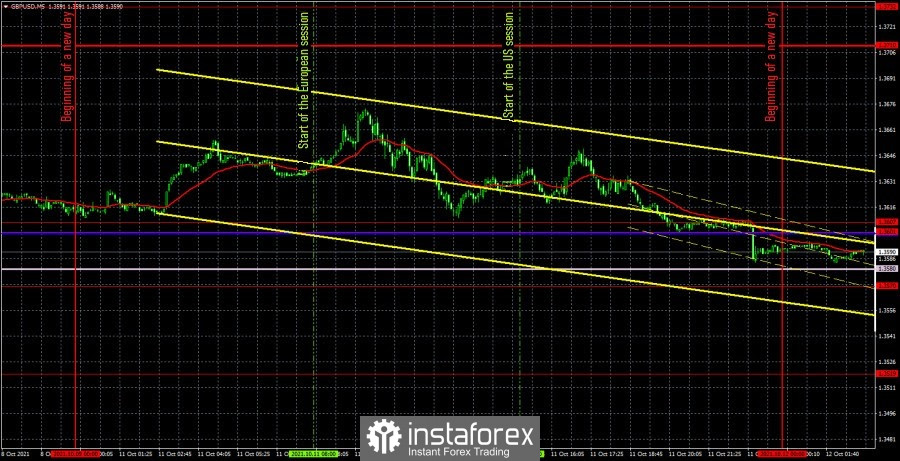
The GBP/USD pair traded slightly better than the EUR/USD pair on October 11, but it managed to extract even less dividends from this than in the case of the euro. The main problem is that the pair has not worked a single important level or line for the whole day. Thus, not a single sensible trading signal was generated. Therefore, traders did not have to open positions on the first trading day of the week. Macroeconomic reports were also not available in either the US or the UK. In the first half of the day, quotes grew more, and in the second, they fell even more. Thus, market participants have not decided on the direction of movement during the day. Recall that the technical and fundamental picture for the pound is now quite ambiguous on all timeframes. The upward movement seems to continue, but at the same time it is somehow too strained. The fundamental background now contains too many potentially important topics, but at the same time it is very difficult to say to which of them traders react and whether they react at all to at least something? After all, the volatility for the pound/dollar pair also leaves much to be desired. If 40-50 points a day is considered a low value for the euro currency, then for the pound, 60-70 is a low value. Yesterday the price went from a low to a high of 70 points. Of course, with 70 points of movement, it is quite possible to trade and earn. We only draw your attention to the fact that even six months ago, the normal daily volatility for the pair was 100-130 points. And so it was almost always, except for such periods of time as now.

GBP/USD 1H

This image is no longer relevant

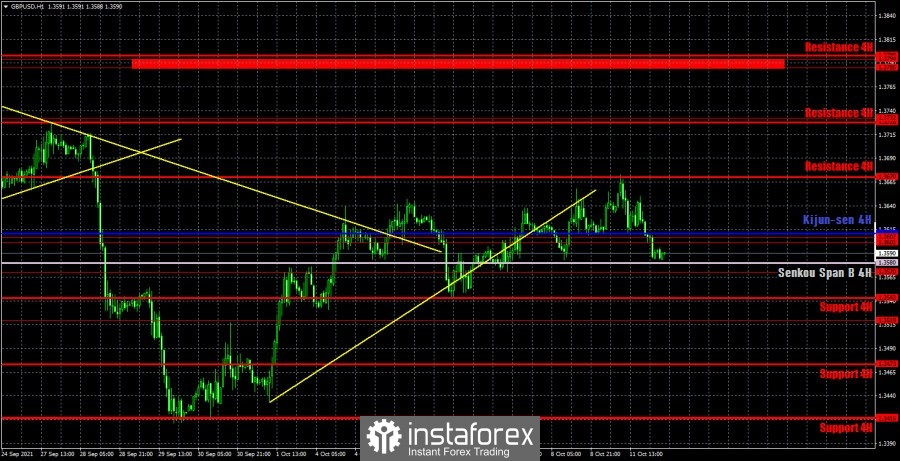
The pound/dollar pair is trying to continue the upward trend on the hourly timeframe. But the upward trend line was already left behind, and it was not possible to settle above the level of 1.3641. Thus, at this time, a new round of correction has begun, while still within the upward trend. However, the pair's movement has recently been very difficult to work out on almost any timeframe, and the movement itself is more like a "fence". In case of a price rebound from the critical line, we can expect a renewed movement to the upside, but at the same time, we would like to draw your attention to the fact that Bollinger bands indicate a flat on the 4-hour TF. And in a flat, the lines of the Ichimoku indicator lose their strength, and the price can overcome them without much difficulty. It is not recommended to use the Ichimoku line as a source of signal in a flat. We distinguish the following important levels on October 12: 1.3519, 1.3570, 1.3601 - 1.3607, 1.3732. Senkou Span B (1.3580) and Kijun-sen (1.3610) lines can also be sources of signals (but there is a high probability that they are false now). It is recommended to set the Stop Loss level at breakeven when the price passes 20 points in the right direction. The Ichimoku indicator lines can move during the day, which should be taken into account when looking for trading signals. The UK is to publish data on unemployment, claims for unemployment benefits and wages on Tuesday. However, it is far from certain that such reports will be worked out by the markets. As we have already said, many reports, and much more important ones, are now ignored by market participants.

We also recommend that you familiarize yourself with the forecast and trading signals for the EUR/USD pair.

COT report

This image is no longer relevant

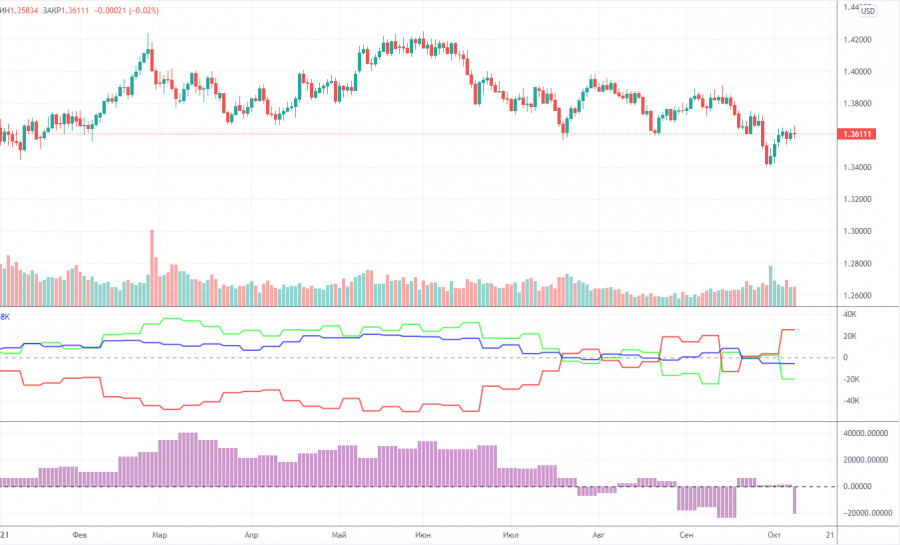
The mood of professional traders became much more bearish again during the last reporting week (September 28 - October 4). "Again" - not because it has been constantly increasing in recent weeks, but because traders could not decide what to do with the British pound. Therefore, their moods became bullish, then returned to being bearish. The last change was again in the direction of bears. Professional traders opened 12,000 sell contracts (shorts) and closed 10,000 buy contracts (longs) in a week. Thus, the net position of the "non-commercial" group decreased by 22,000 contracts at once. In the chart above, you can clearly see how the green line of the first indicator fell. We see the same effect with the second indicator, which displays changes in the net position only of non-commercial traders who are considered the most important and trend-forming group. Thus, the bearish mood now prevails, as in the case of the European currency. Technique is also talking about a very likely resumption of downward movement. However, looking at price changes over the past year and comparing them with Commitment of Traders (COT) reports, it becomes clear that not everything is so simple. Simply because the pound is still very weakly corrected against the global upward trend. For example, the peak value of the "non-commercial" net position over the last year was approximately 40,000. At the moment we have a peak minimum value of - 20,000. And the price is still in the same weak downward correction globally.

Explanations for the chart:

Support and Resistance Levels are the levels that serve as targets when buying or selling the pair. You can place Take Profit near these levels.

Kijun-sen and Senkou Span B lines are lines of the Ichimoku indicator transferred to the hourly timeframe from the 4-hour one.

Support and resistance areas are areas from which the price has repeatedly rebounded off.

Yellow lines are trend lines, trend channels and any other technical patterns.

Indicator 1 on the COT charts is the size of the net position of each category of traders.

Indicator 2 on the COT charts is the size of the net position for the non-commercial group.

Paolo Greco,
ผู้เชี่ยวชาญด้านการวิเคราะห์ของ InstaForex
© 2007-2025
เลือกช่วงเวลา
5
นาที
15
นาที
30
นาที
1
ชั่วโมง
4
ชั่วโมง
1
วัน
1
สัปดาห์
รับผลกำไรจากการเปลี่ยนแปลงอัตราสกุลเงินดิจิทัลกับ InstaForex.
ดาวน์โหลด MetaTrader 4 และเปิดการซื้อขายครั้งแรกของคุณ.
การวิเคราะห์ EUR/USD - 31 มีนาคม โครงสร้างคลื่นบนแผนภูมิ 4 ชั่วโมงของ EUR/USD กำลังมีความเสี่ยงที่จะเปลี่ยนรูปร่างเป็นรูปแบบที่ซับซ้อนยิ่งขึ้น ในวันที่ 25 กันยายนปีที่ผ่านมา โครงสร้างลดลงใหม่เริ่มที่จะการสร้างและอยู่ในรูปแบบของลัพธ์คลื่นห้า สามเดือนที่ผ่านมา โครงสร้างแก้ไขขึ้นเริ่มที่จะการสร้างในที่ควรจะประกอบด้วยคลื่นอย่างน้อยสามคลื่น โครงสร้างของคลื่อแรกถูกสร้างขึ้นอย่างดีและจึงทำให้ฉันคาดว่าคลื่นที่สองจะต้องมีรูปร่างที่ชัดเจนเช่นเดียวกัน อย่างไรก็ตาม ขนาดของคลื่นนี้ใหญ่มากจนเป็นอันตรายถ้ามันเปลี่ยนรูปแบบคลื่นอย่างมาก ข่าวสารที่ส่งออกมายังคงสนับสนุนผู้ขายมากกว่าผู้ซื้อเมื่อมาถึงข้อมูลทางเศรษฐกิจ
  • Grand Choice
    Contest by
    InstaForex
    InstaForex always strives to help you
    fulfill your biggest dreams.
    เข้าร่วมการแข่งขัน


บทความแนะนำ

GBP/USD: แผนการเทรดสำหรับช่วงตลาดสหรัฐในวันที่ 31 มีนาคม (วิเคราะห์การเทรดในช่วงเช้า)

ในคำทำนายตอนเช้าของฉัน ฉันได้มุ่งเน้นไปที่ระดับ 1.2966 และวางแผนการตัดสินใจในการซื้อขายโดยอิงจากระดับนี้ ลองดูแผนภูมิ 5 นาทีและวิเคราะห์ว่าเกิดอะไรขึ้น มีการเพิ่มขึ้นตามด้วยการทะลุออกปลอมใกล้ระดับ 1.2966 ซึ่งให้โอกาสขายสำหรับเงินปอนด์ ทำให้ราคาลดลงไปยังแนวรับตอนเช้าที่ 1.2945 การทะลุและการทดสอบระดับนี้อีกครั้งให้สัญญาณอีกครั้งในการขาย ทำให้คู่สกุลเงินลดลงไปที่ 1.2922

Miroslaw Bawulski 19:52 2025-03-31 UTC+2

EUR/USD: แผนการเทรดสำหรับช่วงเซสชันสหรัฐอเมริกาในวันที่ 31 มีนาคม (วิเคราะห์การซื้อขายในช่วงเช้า)

ในการพยากรณ์เช้านี้ ฉันได้ระบุระดับ 1.0829 ไว้และวางแผนที่จะตัดสินใจการซื้อขายบนฐานตัวเลขดังกล่าว มาดูกราฟ 5 นาทีเพื่อดูว่าเกิดอะไรขึ้น การลดลงตามมาด้วยการทะลุขึ้นผิดพลาดรอบ ๆ ระดับ 1.0829 ซึ่งให้จุดเริ่มต้นสำหรับตำแหน่งซื้อ ส่งผลให้คู่เงินขึ้นไป 20 จุด

Miroslaw Bawulski 19:50 2025-03-31 UTC+2

วิธีการเทรดคู่สกุลเงิน GBP/USD ในวันที่ 31 มีนาคม? เคล็ดลับง่ายๆ และการวิเคราะห์การเทรดสำหรับผู้เริ่มต้น

คู่เงิน GBP/USD มีการเคลื่อนไหวในแนวนอนในวันศุกร์ ซึ่งแตกต่างจากคู่เงิน EUR/USD และนั่นค่อนข้างแปลก เนื่องจากเงินปอนด์อังกฤษได้เคลื่อนไหวในช่วงแบบแบนโดยไม่มีขอบเขตที่ชัดเจนมาหลายสัปดาห์แล้ว อย่างไรก็ตาม การเคลื่อนไหวในแนวนอนยังคงสามารถมองเห็นได้ชัดเจน เงินปอนด์ไม่ตกและไม่ขึ้น อย่างน่าสนใจ เงินยูโรไม่มีเหตุผลมากพอที่จะขึ้นในวันศุกร์ ทั้งๆ ที่เงินปอนด์มี มีข้อมูล

Paolo Greco 03:21 2025-03-31 UTC+2

วิธีเทรดคู่เงิน EUR/USD ในวันที่ 31 มีนาคม? เคล็ดลับง่ายๆ และการวิเคราะห์การเทรดสำหรับผู้เริ่มต้น

ในวันศุกร์ คู่สกุลเงิน EUR/USD มีการซื้อขายเพิ่มขึ้นอีกครั้ง เราไม่สามารถสรุปว่าเหตุการณ์ทางเศรษฐกิจมหภาคสนับสนุนการเคลื่อนไหวนี้ได้ ขณะนี้ไม่น่าแปลกใจที่ดอลลาร์สามารถลดลงได้ทุกเมื่อ สิ่งที่ต้องจำคือสกุลเงินดอลลาร์สหรัฐยังคงอยู่ภายใต้แรงกดดันจาก Donald Trump เมื่อวันพฤหัสบดีที่ผ่านมา เขาได้กำหนดภาษีใหม่ ซึ่งส่งผลให้มูลค่าของดอลลาร์ลดลงอีก อย่างไรก็ตาม ในวันศุกร์ อัตราการว่างงานในประเทศเยอรมนีเพิ่มขึ้น

Paolo Greco 03:21 2025-03-31 UTC+2

GBP/USD: แผนการเทรดสำหรับช่วงตลาดสหรัฐวันที่ 28 มีนาคม (รีวิวการเทรดช่วงเช้า)

ในการพยากรณ์ช่วงเช้าของฉัน ฉันได้มุ่งเน้นไปที่ระดับ 1.2964 และวางแผนที่จะตัดสินใจเข้าสู่ตลาดตามระดับนี้ มาดูกราฟ 5 นาทีและวิเคราะห์สิ่งที่เกิดขึ้น การเพิ่มขึ้นและการทะลุผ่านเท็จรอบๆ 1.2964 ทำให้เกิดสัญญาณขายสำหรับปอนด์ ซึ่งส่งผลให้เกิดการลดลงไปยังระดับสนับสนุนในตอนเช้าที่ 1.2940 จากที่ฉันเคยซื้อ GBP/USD ในช่วงเริ่มต้นของเซสชั่นยุโรป

Miroslaw Bawulski 18:54 2025-03-28 UTC+2

EUR/USD: แผนการซื้อขายสำหรับช่วงการซื้อขายในสหรัฐอเมริกาวันที่ 28 มีนาคม (การวิเคราะห์การซื้อขายตอนเช้า)

ในคาดการณ์ช่วงเช้าของฉัน ฉันได้เน้นไปที่ระดับ 1.0801 และวางแผนที่จะใช้เป็นฐานในการเข้าตลาด ลองมาดูกราฟ 5 นาทีเพื่อดูว่าเกิดอะไรขึ้น การเพิ่มขึ้นและการเบรกหลอกที่ระดับ 1.0801 ทำให้มีโอกาสในการเปิดตำแหน่งขายระยะสั้น ซึ่งส่งผลให้คู่สกุลเงินตกลงไปมากกว่า 35 จุดถึงระดับเป้าหมายที่ 1.0764 ภาพทางเทคนิคไม่ได้รับการปรับปรุงใหม่ในครึ่งหลังของวัน

Miroslaw Bawulski 18:52 2025-03-28 UTC+2

วิธีการเทรดคู่สกุลเงิน GBP/USD ในวันที่ 28 มีนาคม? เคล็ดลับง่ายๆ และการวิเคราะห์การเทรดสำหรับผู้เริ่มต้น

เมื่อวันพฤหัสบดี คู่สกุลเงิน GBP/USD ก็มีการซื้อขายสูงขึ้นอีกแล้ว—และค่อนข้างแข็งแกร่ง แม้จะมีการเผยแพร่รายงาน GDP ไตรมาสที่ 4 ที่มั่นคงในสหรัฐอเมริกา แต่มันไม่ได้ทำให้ความกดดันต่อตลาดเงินดอลลาร์ลดลงเลย เหตุผลเนื่องจากเมื่อค่ำคืนก่อนหน้า Donald Trump ได้ประกาศภาษีนำเข้าใหม่สำหรับทุกประเทศที่ส่งออกรถยนต์มายังสหรัฐอเมริกา เป็นผลให้เงินปอนด์ยังไม่เริ่มการลดลงที่คาดหวังไว้

Paolo Greco 06:05 2025-03-28 UTC+2

วิธีการเทรดคู่สกุลเงิน EUR/USD ในวันที่ 28 มีนาคม เคล็ดลับง่ายๆ และการวิเคราะห์การเทรดสำหรับผู้เริ่มต้น

คู่สกุลเงิน EUR/USD เพิ่มขึ้นถึงระดับ 1.0804 เมื่อวันพฤหัสบดี การเพิ่มขึ้นของค่าเงินยูโร (หรือที่จริงแล้ว เป็นการลดลงของดอลล่าร์) อย่างฉับพลันและค่อนข้างแข็งแรงนี้มีเพียงหนึ่งคนที่จะทำให้เกิดขึ้นได้—โดนัลด์ ทรัมป์ ช่วงกลางคืนที่ผ่านมานี้เขาได้ประกาศภาษีใหม่กับการนำเข้าไปยังสหรัฐฯ โดยครั้งนี้เล็งเป้าหมายไปยังรถยนต์ที่ผลิตในต่างประเทศทั้งหมด Elon Musk ต่างเฉลิมฉลอง

Paolo Greco 06:05 2025-03-28 UTC+2

คำแนะนำและการวิเคราะห์การซื้อขายสำหรับ GBP/USD วันที่ 28 มีนาคม: ปอนด์ยังคงแกว่งตัว

คู่สกุลเงิน GBP/USD แสดงการเคลื่อนไหวขึ้นในวันพฤหัสบดีอย่างเต็มที่ แน่นอนว่าปัจจัยเร่งให้เกิดการเปลี่ยนแปลงนี้คือ Donald Trump อีกครั้ง โดยเขาได้กำหนดภาษี 25% ใหม่สำหรับสินค้านำเข้ารถยนต์ทั้งหมดเข้าสู่สหรัฐฯ ไม่ต้องพูดถึงเลยว่าตลาดได้โละดอลลาร์ออกไปเหมือนเป็นฝันร้าย ไม่แม้กระทั่งรายงาน GDP ของสหรัฐฯ ที่แสดงการเติบโตในไตรมาสสี่ที่

Paolo Greco 02:47 2025-03-28 UTC+2

คำแนะนำและการวิเคราะห์การเทรดสำหรับ EUR/USD ณ วันที่ 28 มีนาคม: ภาษีศุลกากรของ Trump และ GDP

ในวันพฤหัสบดี คู่สกุลเงิน EUR/USD ทะยานขึ้นอย่างรวดเร็วโดยไม่ทำลายแนวโน้มขาลงที่มีอยู่อย่างต่อเนื่องในช่วงวันที่ผ่านมา เหตุผลที่ชัดเจนคือค่าเงินดอลลาร์ลดลงหลังจากที่ Donald Trump ประกาศภาษีใหม่ต่อทุกประเทศที่ส่งออกรถยนต์ไปยังสหรัฐฯ ดังที่คาดไว้ ตลาดตอบสนองด้วยการขายดอลลาร์อีกครั้ง ครั้งนี้ค่าเงินดอลลาร์สหรัฐไม่ได้ละลาย ซึ่งบ่งบอกถึงความก้าวหน้า อย่างไรก็ตาม ประธานาธิบดีสหรัฐฯ ได้สร้างปัญหาให้กับดอลลาร์อีกครั้ง

Paolo Greco 02:47 2025-03-28 UTC+2
หากไม่สะดวกคุยในตอนนี้
ระบุคำถามไว้ได้ใน แชท.
Widget callback
 

Dear visitor,

Your IP address shows that you are currently located in the USA. If you are a resident of the United States, you are prohibited from using the services of InstaFintech Group including online trading, online transfers, deposit/withdrawal of funds, etc.

If you think you are seeing this message by mistake and your location is not the US, kindly proceed to the website. Otherwise, you must leave the website in order to comply with government restrictions.

Why does your IP address show your location as the USA?

  • - you are using a VPN provided by a hosting company based in the United States;
  • - your IP does not have proper WHOIS records;
  • - an error occurred in the WHOIS geolocation database.

Please confirm whether you are a US resident or not by clicking the relevant button below. If you choose the wrong option, being a US resident, you will not be able to open an account with InstaForex anyway.

We are sorry for any inconvenience caused by this message.