empty
24.11.2021 04:29 AM
Forecast and trading signals for EUR/USD on November 24. Detailed analysis of the pair's movement and trade deals. FOMC minutes and important reports in the United States

EUR/USD 5M

This image is no longer relevant

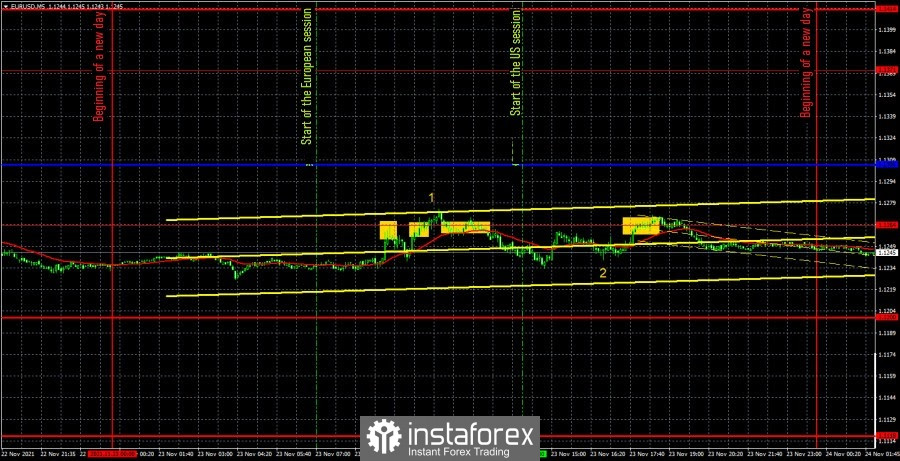
The EUR/USD pair retained its downward trend again on Tuesday, although it would be very difficult to break it within one day if it formed over the past several weeks, at least. The pair moved mainly sideways throughout the day, as evidenced by both linear regression channels. Unfortunately, several false trading signals were generated as well. More precisely, all trading signals that were generated on Tuesday turned out to be false. But what else could be expected from the pair if its volatility was again around 50 points? It seems to be not very small, but provided there is no trend intraday movement, it is not enough. During the day, the European Union and the United States published business activity indices for the services and manufacturing sectors (the time of their publication is the numbers "1" and "2" in the chart). As you can see, there was no market reaction to these reports. However, the reports themselves are "to blame" for this, since they turned out to be as neutral as possible. Thus, all we have to do is to understand the trading signals and understand how we should have worked yesterday. The first signal - to sell - was formed upon a rebound from the level of 1.1264. After that, the pair managed to go down as much as 15 points, after which it returned to the level of 1.1264 and settled above it. Thus, a short position was closed by Stop Loss at breakeven, and traders had to immediately open long positions at a buy signal. However, the pair could not go up even 10 points, and after a few hours it settled back below the level of 1.1264. Thus, the second trade brought a loss to traders worth 12 points. All subsequent signals near the level of 1.1264 should not have been worked out for sure, since two whole signals had turned out to be false by that time.

EUR/USD 1H
This image is no longer relevant

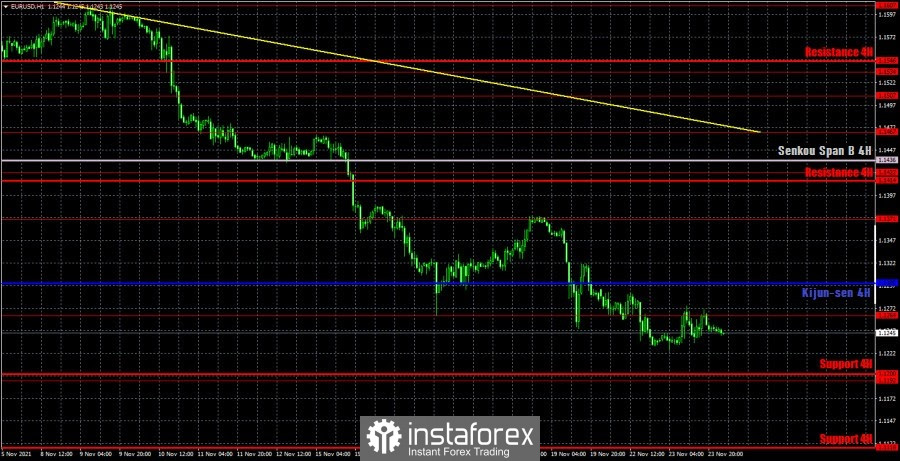
The downward movement continues on the hourly timeframe, and the downward trend is beyond doubt, since the trend line remains relevant. The price continues to be far enough from this line, and the European currency still cannot adjust to it in any way. Thus, although the volatility is not too high this week, and the fundamental and macroeconomic background is practically absent, the euro cannot even begin a correction, so the chances of its fall remain high. We highlight the following levels for trading on Wednesday - 1.1192, 1.1264, 1.1371, 1.1422, as well as the Senkou Span B (1.1436) and Kijun-sen (1.1300) lines. The Ichimoku indicator lines can change their position during the day, which should be taken into account when looking for trading signals. Signals can be rebounds or breakthroughs of these levels and lines. Do not forget about placing a Stop Loss order at breakeven if the price moves 15 points in the right direction. This will protect you against possible losses if the signal turns out to be false. There will not be a single important event or publication in the European Union on November 24. But in the US, several important reports will be released at once, and in the evening the FOMC minutes will be published. Particular attention should be paid to reports on durable goods orders, GDP for the third quarter, as well as personal income and spending of Americans. Under certain circumstances, all of these reports can be easily ignored. But at the same time, the reaction to them can be quite strong, so you should not ignore them.

We recommend you to familiarize yourself:

Overview of the EUR/USD pair. November 24. European economy may need new stimulus... Coronavirus continues to rage

Overview of the GBP/USD pair. November 24. The British pound tried to perk up, but quickly wilted. Coronavirus is attacking Britain too

Forecast and trading signals for GBP/USD for November 24. Detailed analysis of the movement of the pair and trade deals.

Analysis of the COT report
This image is no longer relevant

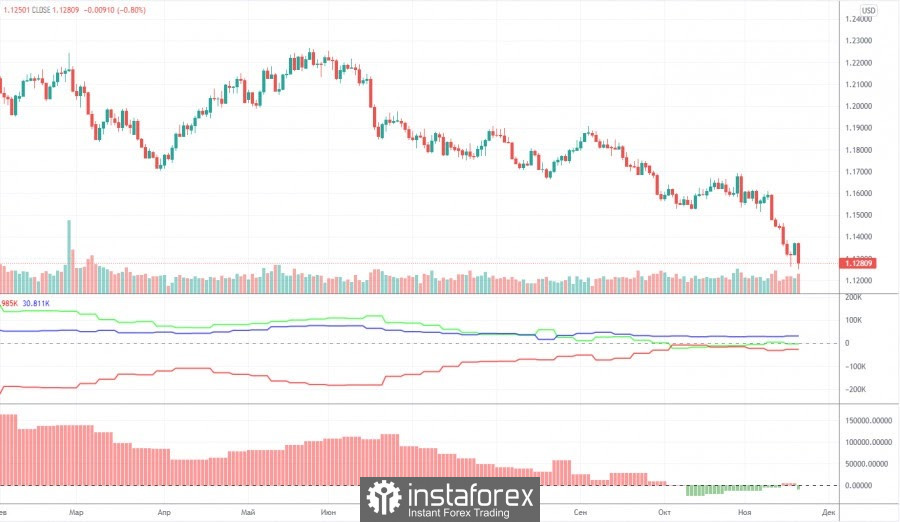
The mood of non-commercial traders changed quite significantly during the last reporting week (November 9-15). A group of non-commercial traders opened 7,000 buy contracts (longs) and 20,500 sell contracts (shorts) during the week. Thus, the net position for professional traders decreased by 13,500, and the mood became more "bearish". It should be noted that the European currency has dropped quite seriously over the past few weeks. But the net position for the "non-commercial" group, starting from October, practically does not change. This is signaled by the green line of the first indicator in the chart above. Almost all this time, it has been near the zero level, indicating the absence of serious changes in the mood of major players. Thus, if the general trend remains the same - over the past ten months, large players have seriously reduced the number of longs and increased the number of shorts, then in the past few weeks nothing of the kind has been observed, and the European currency was still falling. This suggests that what is happening on the market now does not quite correspond to the actions of large players. The second indicator (the net position for professional traders in the form of a histogram) shows that in the last six weeks the mood of traders has become less bearish, that is, in theory, at this time the euro should have been growing, not falling. Thus, if we draw a conclusion only on the basis of the Commitment of Traders (COT) reports, then a further fall in the euro currency is completely unclear.

Explanations for the chart:

Support and Resistance Levels are the levels that serve as targets when buying or selling the pair. You can place Take Profit near these levels.

Kijun-sen and Senkou Span B lines are lines of the Ichimoku indicator transferred to the hourly timeframe from the 4-hour one.

Support and resistance areas are areas from which the price has repeatedly rebounded off.

Yellow lines are trend lines, trend channels and any other technical patterns.

Indicator 1 on the COT charts is the size of the net position of each category of traders.

Indicator 2 on the COT charts is the size of the net position for the non-commercial group.

Paolo Greco,
ผู้เชี่ยวชาญด้านการวิเคราะห์ของ InstaForex
© 2007-2025
Summary
Urgency
Analytic
Stanislav Polyanskiy
Start trade
รับผลกำไรจากการเปลี่ยนแปลงอัตราสกุลเงินดิจิทัลกับ InstaForex.
ดาวน์โหลด MetaTrader 4 และเปิดการซื้อขายครั้งแรกของคุณ.
  • Grand Choice
    Contest by
    InstaForex
    InstaForex always strives to help you
    fulfill your biggest dreams.
    เข้าร่วมการแข่งขัน


บทความแนะนำ

วิธีการเทรดคู่เงิน GBP/USD ในวันที่ 25 กรกฎาคม? เคล็ดลับแบบง่าย ๆ และการวิเคราะห์เทรดสำหรับมือใหม่

ในวันพฤหัสบดี คู่สกุลเงิน GBP/USD แสดงให้เห็นถึงการลดลงอย่างแข็งแกร่งพอสมควร อันมีสาเหตุมาจากดัชนีกิจกรรมทางธุรกิจที่อ่อนแอในสหราชอาณาจักร อย่างไรก็ตาม คำอธิบายนี้ถูกเพียง 50% เท่านั้น ดัชนีกิจกรรมทางธุรกิจในสหรัฐอเมริกาก็ไม่ได้ดีกว่าแต่อย่างใด แต่ค่าเงินดอลลาร์กลับแข็งค่าขึ้นตลอดทั้งวัน ดังนั้นเราจึงไม่เชื่อว่าการลดลงของค่าเงินปอนด์มีสาเหตุหลักจากดัชนีของสหราชอาณาจักร แนวเส้นแนวโน้มขาขึ้นถูกวาดขึ้นตามจุดต่ำสุดทั้งสามครั้งที่ผ่านมา และแม้กระทั่งอยู่เหนือเส้นนี้ ฝ่ายซื้อก็ยังคงมีอำนาจเหนือกว่า

Paolo Greco 06:43 2025-07-25 UTC+2

วิธีการเทรดคู่เงิน EUR/USD ในวันที่ 25 กรกฎาคม? เคล็ดลับง่ายๆ และการวิเคราะห์การซื้อขายสำหรับมือใหม่

คู่สกุลเงิน EUR/USD ไม่ได้มีการเคลื่อนไหวมากนักในวันพฤหัสบดีและยังคงมีความผันผวนต่ำ แม้จะเป็นวันที่มีเหตุการณ์สำคัญมากที่สุดของสัปดาห์ในแง่ของข้อมูลเศรษฐกิจมหภาคและพื้นฐาน ดัชนีกิจกรรมทางธุรกิจในภาคบริการและภาคการผลิตถูกเผยแพร่ในเยอรมนี, ยูโรโซน, และสหรัฐฯ อย่างไรก็ตาม มูลค่าของมันไม่ได้มีความสำคัญควรแก่การกล่าวถึง เนื่องจากไม่มีผลกระทบต่อการเคลื่อนไหวหรือแนวโน้มโดยรวมของคู่สกุลเงิน การประชุมธนาคารกลางยุโรปก็ไม่ได้ส่งผลกระทบมากนักต่อความรู้สึกของผู้เทรด เนื่องจาก ECB ไม่มีการตัดสินใจที่สำคัญ และบทสรุปสุดท้ายไม่มีข้อความที่น่าตื่นเต้นหรือส่งผลต่อการตลาด

Paolo Greco 06:43 2025-07-25 UTC+2

คำแนะนำการเทรดและการวิเคราะห์การเทรดสำหรับ GBP/USD ในวันที่ 25 กรกฎาคม: ปอนด์พบช่วงเวลาสำหรับการปรับฐาน

ในวันพฤหัสบดี คู่สกุลเงิน GBP/USD เคลื่อนไหวต่ำลง ซึ่งสามารถพิจารณาได้ว่าเป็นการปรับฐานในท้องที่ การเคลื่อนที่นี้จะเลิกเป็นการปรับฐานก็ต่อเมื่อราคาสามารถทรงตัวยืนต่ำกว่าระดับของตัวบ่งชี้ Ichimoku ซึ่งปัจจุบันอยู่ใกล้กับราคาปัจจุบัน อย่างไรก็ตาม โอกาสที่จะมีการดีดกลับจากเส้นเหล่านี้ หรือระดับ 1.3509 นั้นมีมากกว่า ในวันพฤหัสบดี สหราชอาณาจักรได้เผยแพร่อัตราดัชนีสองภาคกิจกรรมทางธุรกิจ

Paolo Greco 04:17 2025-07-25 UTC+2

คำแนะนำการซื้อขายและการวิเคราะห์การซื้อขายสำหรับ EUR/USD ในวันที่ 25 กรกฎาคม: ตลาดเคลื่อนไหวโดยไร้ทิศทาง

เมื่อวันพฤหัสบดี คู่สกุลเงิน EUR/USD แสดงความผันผวนต่ำอย่างน่าทึ่งและไม่แสดงเจตนาที่จะเคลื่อนไหวในทิศทางที่ชัดเจนใด ๆ นักเทรดหลายคนคาดหวังว่าจะมีการเคลื่อนไหวที่คล่องแคล่วในระหว่างวัน เนื่องจากเป็นวันหนึ่งในสัปดาห์นี้ที่มีการประกาศข้อมูลเศรษฐกิจมหาภาค อย่างไรก็ตาม ดัชนีกิจกรรมทางธุรกิจทั้งหกจากภาคบริการและการผลิตของเยอรมนี สหภาพยุโรป และสหรัฐอเมริกา ล้มเหลวในการกระตุ้นให้เกิดปฏิกิริยาต่อเนื่องในตลาด เราได้เตือนเมื่อวานนี้ว่าการตอบสนองนั้นอาจจะเงียบเฉย การประชุมธนาคารกลางยุโรปก็เช่นกัน: ไม่มีการตัดสินใจสำคัญใด

Paolo Greco 04:17 2025-07-25 UTC+2

วิธีการแลกเปลี่ยนเงินตราคู่ GBP/USD ในวันที่ 24 กรกฎาคม? เคล็ดลับง่ายๆ และการวิเคราะห์การซื้อขายสำหรับผู้เริ่มต้น

คู่เงิน GBP/USD ยังคงเคลื่อนไหวขึ้นต่อเนื่องในวันพุธ ที่ผ่านมา ตามที่คาดการณ์ไว้ สิ่งนี้เกิดขึ้นโดยไม่ต้องมีข่าวหรือรายงานใดๆ เหมือนที่เราได้กล่าวไว้หลายครั้งแล้วว่า ภาพรวมพื้นฐานทั่วไปเป็นไปอย่างเพียงพอที่จะให้ดอลลาร์สหรัฐยังคงอ่อนค่าลง ตลาดมักจะมีท่าทีต่อสงครามของ Donald Trump กับ Powell และสงครามการค้าระดับโลก หากแนวโน้มเศรษฐกิจสหรัฐฯ

Paolo Greco 07:12 2025-07-24 UTC+2

วิธีการเทรดคู่สกุลเงิน EUR/USD ในวันที่ 24 กรกฎาคม? เคล็ดลับง่ายๆ และการวิเคราะห์การเทรดสำหรับผู้เริ่มต้น

ในวันพุธ ค่าเงินคู่ EUR/USD ยังคงเคลื่อนไหวขึ้นอย่างต่อเนื่อง โดยพื้นฐานแล้ว เราเห็นรูปแบบเดียวกันทุกวันในสัปดาห์นี้ — ดอลลาร์ยังคงลดลงตามที่คาดหลังจากที่ราคาขึ้นไปอยู่เหนือเส้นแนวโน้มขาลง ในช่วงสามวันแรกของสัปดาห์ ไม่มีประกาศเศรษฐกิจมหภาคที่สำคัญเลย และถึงกระนั้น ผู้ค้าก็ยังคงทำการขายเงินดอลลาร์สหรัฐออกไป เมื่อต้นสัปดาห์ Donald Trump

Paolo Greco 07:12 2025-07-24 UTC+2

ข้อเสนอแนะในการซื้อขายและการวิเคราะห์การซื้อขายสำหรับ GBP/USD วันที่ 24 กรกฎาคม: ปอนด์ไม่มีเหตุผลที่จะหยุดชะงัก

แตกต่างจากคู่สกุลเงิน EUR/USD คู่สกุลเงิน GBP/USD ยังคงเคลื่อนไหวขึ้นอย่างต่อเนื่องในวันพุธ แม้จะไม่มีเหตุการณ์เศรษฐศาสตร์มหภาคสำคัญใดๆ ในสหรัฐหรือสหราชอาณาจักรในระหว่างวัน นักเทรดยังคงซื้อลงทุนในปอนด์และขายดอลลาร์ต่อไป เราได้พูดถึงสาเหตุเหล่านี้หลายครั้งแล้ว ซึ่งเป็นเหตุผลที่มีระดับโลกและระยะยาว ดังนั้น หากคุณเห็นดอลลาร์ลดลงอีกใน "วันที่เงียบสงบ" ก็ไม่ควรแปลกใจ—มันมีเหตุผลโดยสมบูรณ์ นักเทรดยังประเมินนโยบายการค้า

Paolo Greco 04:02 2025-07-24 UTC+2

คำแนะนำในการซื้อขายและการวิเคราะห์การซื้อขายสำหรับ EUR/USD ในวันที่ 24 กรกฎาคม: ข้อตกลงการค้าของทรัมป์ไม่ได้ส่งผลดีต่อค่าเงินดอลลาร์

คู่สกุลเงิน EUR/USD ไม่ปรากฎการเคลื่อนไหวเด่นในวันพุธ และตลาดไม่มีความสนใจในข้อตกลงการค้าของ Donald Trump อย่างที่เราเคยพูดไว้ซ้ำ ๆ ว่าข้อตกลงการค้ามีประโยชน์อะไรหากภาษียังไม่ได้รับการยกเลิก? เมื่อการเจรจาการค้าเริ่มต้นขึ้น ตลาดคาดหวังว่าในที่สุดพวกเขาจะยุติสงครามการค้า - หรืออย่างน้อยก็ส่งผลให้เกิดข้อตกลงที่เป็นธรรมโดยไม่มีภาษีและเงื่อนไขมากมาย แต่ในทางปฏิบัติเรากลับเห็นสิ่งที่ตรงกันข้าม ข้อตกลงจะถูกลงนามตามที่

Paolo Greco 04:02 2025-07-24 UTC+2

วิธีการเทรดคู่สกุลเงิน GBP/USD ในวันที่ 23 กรกฎาคม? เคล็ดลับง่ายๆ และการวิเคราะห์การเทรดสำหรับมือใหม่

คู่สกุลเงิน GBP/USD ยังคงเคลื่อนไหวขึ้นอย่างต่อเนื่องในวันอังคาร ซึ่งตามคาดการณ์นั้นไม่จำเป็นต้องมีข่าวหรือรายงานใด ๆ มาเป็นแรงกระตุ้น เราอาจคาดได้ว่าคำพูดของ Jerome Powell ก่อให้เกิดการลดลงอีกครั้งของเงินดอลลาร์สหรัฐ แต่เช้าวันพุธนี้ยังไม่มีข้อมูลยืนยันเช่นนั้น โดยที่ Powell ไม่ได้ลาออกตามที่ผู้เชี่ยวชาญบางคนคาดหวังไว้ พร้อมทั้งยังแสดงความพร้อมจะปกป้องศักดิ์ศรีและชื่อเสียงของตนต่อข้อกล่าวหาของ

Paolo Greco 06:51 2025-07-23 UTC+2

วิธีการเทรดคู่เงิน EUR/USD ในวันที่ 23 กรกฎาคม? เคล็ดลับง่ายๆ และการวิเคราะห์การซื้อขายสำหรับผู้เริ่มต้น

เมื่อวันอังคารที่แล้ว ค่าเงิน EUR/USD ได้ดำเนินการเคลื่อนไหวในทิศทางขาขึ้นต่อเนื่องตามที่คาดไว้ ก่อนหน้านี้ วันที่เกิดขึ้นได้ทำให้ราคาทะลุเส้นแนวโน้มลงไปได้ ส่งผลให้ช่วงแนวโน้มลงที่ดำเนินมาเป็นเวลาสามสัปดาห์สิ้นสุดลง ดังนั้น อย่างน้อยที่สุดจึงมีเหตุผลทางเทคนิคที่คาดว่าจะมีการเพิ่มขึ้นใหม่ ในช่วงไม่กี่สัปดาห์ที่ผ่านมา ปัจจัยทางเทคนิคนับเป็นเครื่องมือหลักสำหรับการวิเคราะห์และพยากรณ์ เป็นที่ทราบกันดีว่าในช่วงไม่กี่สัปดาห์ที่ผ่านมา ประธานาธิบดี Donald Trump

Paolo Greco 06:51 2025-07-23 UTC+2
หากไม่สะดวกคุยในตอนนี้
ระบุคำถามไว้ได้ใน แชท.
Widget callback
 

Dear visitor,

Your IP address shows that you are currently located in the USA. If you are a resident of the United States, you are prohibited from using the services of InstaFintech Group including online trading, online transfers, deposit/withdrawal of funds, etc.

If you think you are seeing this message by mistake and your location is not the US, kindly proceed to the website. Otherwise, you must leave the website in order to comply with government restrictions.

Why does your IP address show your location as the USA?

  • - you are using a VPN provided by a hosting company based in the United States;
  • - your IP does not have proper WHOIS records;
  • - an error occurred in the WHOIS geolocation database.

Please confirm whether you are a US resident or not by clicking the relevant button below. If you choose the wrong option, being a US resident, you will not be able to open an account with InstaForex anyway.

We are sorry for any inconvenience caused by this message.