empty
25.12.2021 11:03 AM
EUR/USD analysis for December 20 - 24. COT (Commitments of Traders) report. Pair continues to trade sideways

EUR/USD analysis on daily chart

This image is no longer relevant

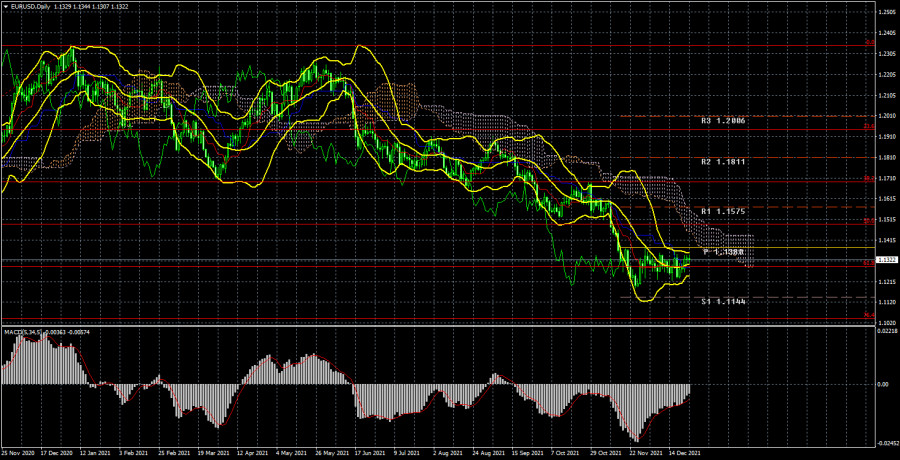
The EUR/USD pair continued to remain inside the sideways channel during the current week. This can be seen on the chart above. In general, the technical picture has not changed for a month. All this time EUR/USD has been trading near 61.8% Fibonacci - 1.1288, in the 120 pips wide sideways channel. Thus, even the formal breakout of the critical line does not play any role now, for it is not the price that has consolidated above the important line, but the line itself has fallen below the price. This is a fundamental difference. Therefore, it is impossible to make a conclusion about the beginning of correction now. Moreover, if this week the pair's sideways movement was justified, as there was no macroeconomic statistics and fundamental background, then during the previous three weeks the pair was moving in the flat exclusively on its initiative. As a result, the current downtrend persists and at any moment it may resume its downward movement. Bulls show lack of activity week after week, so it is unclear what to expect from the euro now. There was not a single interesting event in the EU or the US this week. The market was discussing the new strain of Omicron during the week, which continues to spread at a high rate in both EU countries and the US. However, Joe Biden has already said that he is going to fight the new strain solely with vaccination and revaccination, and there is no talk of shutting down the economy for a lockdown. In the European Union, several countries have imposed lockdowns, but most counties do not intend to do so. Yesterday, it also became known that Omicron strain leads to hospitalizations 2-3 times less often than Delta strain. This news eased tensions in the market.

COT report analysis

This image is no longer relevant

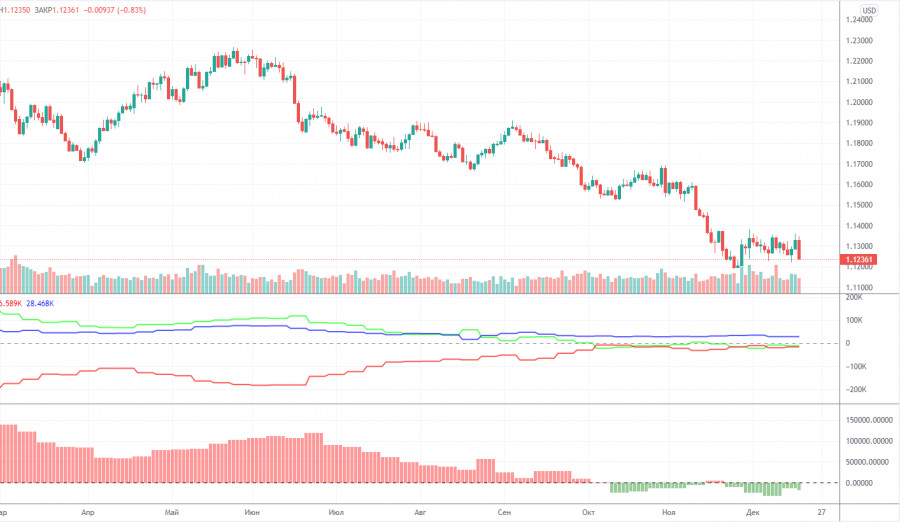
During the last reporting week (December 7 - 13), the mood of non-commercial traders became slightly more bearish. The "Non-commercial" group of traders now has more short positions open than long ones, but this difference is not significant. The difference is only 18,000 contracts, which is not much. During the reporting week professional traders closed 7,200 buy contracts and 2,800 sell contracts. Thus, the net position of professional players decreased by 4,000. However, the main thing is that the green and red lines of the first indicator (indicating the change in the net positions of the "Non-commercial" and "Commercial" groups) have been near the zero level for a long time, as well as close to each other. That is, in the last few months, when the euro continued to fall against the US dollar, the big players stopped opening short positions. Thus, the question arises, why was the euro falling at all, if the market participants didn't sell it out? Perhaps, global factors, like the change of the balance between the money supply in the EU and the US, interfere with the rate-making process. We can only conclude from the COT reports that the bearish sentiment is minimal and has not increased in recent months. Nonetheless, given the fundamental background, the decline in the euro might continue. The technical picture does not give any reasons to assume that the decline of the euro is over. Big players' sentiment remains bearish and bulls do not intend to change anything. The new COT report was not released on Friday due to the Christmas holiday.

Fundamental data analysis

There is almost a complete absence of fundamental data this week. Notably, nothing influenced the traders' sentiment or the trend of the EUR/USD pair. However, even a week before the results of the ECB and Fed meetings were summed up, the pair remained in the same sideways channel. So, the pair is flat now and there is nothing we can do about it and hardly anything will change next New Year's week.

Trading plan for December 27 - 31:

1) On the daily chart the trend remains downward. However, the movement itself in recent weeks is flat. So, the downside movement may continue at any moment with the support levels of 1.1144 and 1.1038 (76.4% Fibonacci), but most likely, it may happen next year. The general fundamental background at the moment supports a further drop of the euro and growth of the US dollar. The only hope for the euro is that all the growth factors of the US dollar have already impacted the market.

2) As for the long positions in the euro/dollar pair, traders should refrain from opening them before the price fixes above the Ichimoku cloud, because the price has already broken through the Kijun-sen several times, but then could not continue to move up. There are no prerequisites for a new uptrend to start shortly.

Descriptions to charts:

Price levels of support and resistance (resistance/support), Fibonacci levels, which are target levels for the opening of purchases or sales. Take-profit orders may be placed near them.

Indicators Ichimoku cloud (standard settings), Bollinger Bands (standard settings), MACD (5, 34, 5).

Indicator 1 on the COT charts - the size of the net position of each group of traders.

Indicator 2 on the COT charts - the size of the net position for the "Non-commercial" group.

Paolo Greco,
ผู้เชี่ยวชาญด้านการวิเคราะห์ของ InstaForex
© 2007-2025
เลือกช่วงเวลา
5
นาที
15
นาที
30
นาที
1
ชั่วโมง
4
ชั่วโมง
1
วัน
1
สัปดาห์
รับผลกำไรจากการเปลี่ยนแปลงอัตราสกุลเงินดิจิทัลกับ InstaForex.
ดาวน์โหลด MetaTrader 4 และเปิดการซื้อขายครั้งแรกของคุณ.
EUR/USD: แผนการเทรดสำหรับช่วงสหรัฐอเมริกาในวันที่ 4 กรกฎาคม (ทบทวนการซื้อขายในช่วงเช้า) ในการพยากรณ์ตอนเช้าของฉัน ฉันเน้นระดับ 1.1787 ว่าเป็นจุดสำคัญในการตัดสินใจซื้อขาย ลองมาดูกราฟ 5 นาทีเพื่อวิเคราะห์สิ่งที่เกิดขึ้น การขึ้นและการทะลุเทียมใกล้ 1.1787 นำไปสู่การเข้าสู่สถานะขาย แต่การลดลงอย่างมีนัยสำคัญในคู่สกุลเงินไม่ได้เกิดขึ้น มุมมองทางเทคนิคไม่ได้เปลี่ยนแปลงสำหรับช่วงครึ่งหลังของวัน ข้อมูลอ่อนของคำสั่งซื้อภาคอุตสาหกรรมของเยอรมันและยอดขายปลีกของอิตาลีได้จำกัดศักยภาพการขึ้นของคู่เงินนี้ในช่วงครึ่งแรกของวัน ในการซื้อขายช่วงสหรัฐฯ ความผันผวนอาจลดลงเพิ่มเติมเนื่องจากวันหยุด
USD/JPY: การวิเคราะห์และพยากรณ์ คู่เงิน USD/JPY กำลังถืออยู่เหนือระดับสำคัญที่ 144.00 ท่ามกลางความอ่อนแออย่างต่อเนื่องของดอลลาร์สหรัฐฯ ข้อมูลการใช้จ่ายของครัวเรือนที่แข็งแกร่งซึ่งถูกเผยแพร่ในญี่ปุ่นวันนี้ได้เพิ่มความคาดหวังว่าจะมีการขึ้นอัตราดอกเบี้ยจากธนาคารกลางญี่ปุ่น ซึ่งส่งผลให้ค่าเงินเยนแข็งตัวขึ้น นอกจากนี้ ความไม่แน่นอนเกี่ยวกับจุดยืนนโยบายของประธานาธิบดีโดนัลด์ ทรัมป์ ของสหรัฐฯ กำลังย้ำสถานะของเยนในฐานะสินทรัพย์ปลอดภัย อย่างไรก็ตาม ความกังวลของนักลงทุนยังคงสูงขึ้นเนื่องจากความตึงเครียดทางการค้าที่เกิดจากคำขู่ของทรัมป์ที่จะเพิ่มภาษีศุลกากรสำหรับสินค้าญี่ปุ่น โดยอ้างว่าญี่ปุ่นไม่เต็มใจที่จะซื้อข้าวสหรัฐฯ
  • Grand Choice
    Contest by
    InstaForex
    InstaForex always strives to help you
    fulfill your biggest dreams.
    เข้าร่วมการแข่งขัน


บทความแนะนำ

EUR/USD: แผนการเทรดสำหรับช่วงสหรัฐอเมริกาในวันที่ 4 กรกฎาคม (ทบทวนการซื้อขายในช่วงเช้า)

ในการพยากรณ์ตอนเช้าของฉัน ฉันเน้นระดับ 1.1787 ว่าเป็นจุดสำคัญในการตัดสินใจซื้อขาย ลองมาดูกราฟ 5 นาทีเพื่อวิเคราะห์สิ่งที่เกิดขึ้น การขึ้นและการทะลุเทียมใกล้ 1.1787 นำไปสู่การเข้าสู่สถานะขาย แต่การลดลงอย่างมีนัยสำคัญในคู่สกุลเงินไม่ได้เกิดขึ้น มุมมองทางเทคนิคไม่ได้เปลี่ยนแปลงสำหรับช่วงครึ่งหลังของวัน ข้อมูลอ่อนของคำสั่งซื้อภาคอุตสาหกรรมของเยอรมันและยอดขายปลีกของอิตาลีได้จำกัดศักยภาพการขึ้นของคู่เงินนี้ในช่วงครึ่งแรกของวัน ในการซื้อขายช่วงสหรัฐฯ ความผันผวนอาจลดลงเพิ่มเติมเนื่องจากวันหยุด

Miroslaw Bawulski 18:16 2025-07-04 UTC+2

วิธีการเทรดคู่สกุลเงิน GBP/USD ในวันที่ 4 กรกฎาคม? เคล็ดลับง่ายๆ และการวิเคราะห์การเทรดสำหรับผู้เริ่มต้น

ในวันพฤหัสบดี คู่สกุลเงิน GBP/USD ได้ร่วงลงอีกครั้ง แต่ครั้งนี้การร่วงลงของค่าเงินอังกฤษกินเวลาเพียงแค่ห้านาที เหตุผลที่สกุลเงินดอลลาร์สหรัฐแข็งค่าขึ้นในวันพฤหัสบดีนั้นมีความสำคัญมากกว่าวันพุธ แต่ถึงกระนั้นเมื่อสิ้นสุดวันพฤหัสบดี ดอลลาร์ก็ไม่ได้แข็งค่าขึ้นแม้แต่จุดเดียวเลย ต้องย้อนไปในวันพุธ นักวิเคราะห์จำนวนมากคาดการณ์ว่าค่าเงินอังกฤษได้ร่วงลงไปถึง 200 จุดเพราะว่ารัฐมนตรีคลัง UK Rachel Reeves

Paolo Greco 07:16 2025-07-04 UTC+2

วิธีการเทรดคู่สกุลเงิน EUR/USD ในวันที่ 4 กรกฎาคม? เคล็ดลับง่ายๆ และการวิเคราะห์การเทรดสำหรับผู้เริ่มต้น

คู่สกุลเงิน EUR/USD ได้มีการซื้อขายตลอดวันพฤหัสบดี ทั้งก่อนและหลังการประกาศข้อมูลการจ้างงานนอกภาคเกษตรและอัตราการว่างงานของสหรัฐฯ การเคลื่อนไหวของราคาอยู่ในรูปแบบแนวราบอย่างสมบูรณ์ทั้งก่อนและหลังการเผยแพร่ข้อมูลเศรษฐกิจมหภาคของสหรัฐฯ ทันทีที่รายงานถูกเผยแพร่ออกมา ราคาก็ลดลงอย่างรวดเร็ว แต่ภายในชั่วโมงถัดมา ราคาก็กลับฟื้นตัวขึ้นเกือบเต็มที่ อัตราการว่างงานของสหรัฐฯ ลดลงมาอยู่ที่ 4.1% ซึ่งขัดกับการคาดการณ์ และจำนวนการจ้างงานนอกภาคเกษตรเพิ่มขึ้น 147,000

Paolo Greco 06:34 2025-07-04 UTC+2

คำแนะนำและการวิเคราะห์สำหรับการซื้อขาย GBP/USD ในวันที่ 4 กรกฎาคม: ดอลลาร์เพิ่มขึ้น — แล้วลดลงอีกครั้ง

คู่สกุลเงิน GBP/USD ในวันพฤหัสบดีโชว์ความเคลื่อนไหวที่เกือบจะเหมือนกันกับคู่สกุลเงิน EUR/USD ซึ่งไม่น่าแปลกใจเท่าไหร่ เพราะในช่วงห้าเดือนที่ผ่านมาไม่ใช่ยูโรหรือปอนด์ที่เพิ่มขึ้น แต่เป็นดอลลาร์ที่ตกลง ดังนั้น ใน 95% ของกรณี ดอลลาร์มักจะร่วงหรือไม่ก็อยู่เท่านั้น ในสัปดาห์นี้ ปอนด์อังกฤษได้รับแรงกดดันเพียงครั้งเดียวจากปัจจัยที่ไม่เกี่ยวข้องกับข่าวของสหรัฐฯ อย่างไรก็ตาม

Paolo Greco 03:56 2025-07-04 UTC+2

คำแนะนำและการวิเคราะห์การซื้อขายสำหรับ EUR/USD ในวันที่ 4 กรกฎาคม: วันประกาศอิสรภาพของสหรัฐอเมริกา

คู่สกุลเงิน EUR/USD มีการซื้อขายอย่างมีความเคลื่อนไหวในวันพฤหัสบดี ส่วนใหญ่ของวันเราสังเกตเห็นความเคลื่อนไหวด้านข้างที่มีความผันผวนต่ำ และทันทีที่มีการเปิดเผยข้อมูลตลาดแรงงานและอัตราการว่างงานของสหรัฐฯ ราคาก็ลดลง และการลดลงนี้ไม่ใช่เรื่องที่ไร้เหตุผล เนื่องจากรายงานที่สำคัญที่สุดสองฉบับของสัปดาห์ออกมาดีกว่าที่คาดการณ์ไว้ อัตราการว่างงานลดลงในเดือนมิถุนายน ซึ่งขัดกับตรรกะและความรู้สึกทั่วไป และตัวเลขการจ้างงานนอกภาคการเกษตร (NonFarm Payrolls) ก็สูงกว่าที่คาดหวังไว้อย่างมาก อย่างไรก็ตาม

Paolo Greco 03:56 2025-07-04 UTC+2

GBP/USD: แผนการซื้อขายสำหรับตลาดสหรัฐฯ วันที่ 3 กรกฎาคม (รีวิวการซื้อขายช่วงเช้า)

ในบทวิเคราะห์ตอนเช้าของฉัน ฉันได้เน้นไปที่ระดับ 1.3659 และวางแผนการตัดสินใจซื้อขายโดยอิงตามระดับนี้ ลองดูกราฟ 5 นาทีและทบทวนเหตุการณ์ที่เกิดขึ้น ราคาปรับตัวสูงขึ้นและเกิดการทะลุปลอมรอบ 1.3659 ซึ่งเป็นจุดเข้าที่ดีสำหรับการขายปอนด์แต่หลังจากลดลงไป 15 จุด ความต้องการก็กลับมาอีกครั้ง มุมมองทางเทคนิคถูกปรับปรุงใหม่สำหรับครึ่งหลังของวัน การเปิดสถานะ

Miroslaw Bawulski 15:34 2025-07-03 UTC+2

EUR/USD: แผนการเทรดสำหรับช่วงการซื้อขายในสหรัฐอเมริกาวันที่ 3 กรกฎาคม (ทบทวนการซื้อขายช่วงเช้า)

ในคำพยากรณ์ช่วงเช้าของฉัน ฉันได้เน้นถึงระดับ 1.1784 ว่าเป็นจุดอ้างอิงสำคัญสำหรับการเข้าสู่ตลาด มาดูกราฟ 5 นาทีและวิเคราะห์สิ่งที่เกิดขึ้นกัน ราคาปรับตัวลดลงมาทางระดับ 1.1784 แต่ไม่เคยถึงระดับนั้นจริง ๆ — ดังนั้นจึงไม่มีการซื้อขายเกิดขึ้น มุมมองทางเทคนิคสำหรับครึ่งหลังของวันยังคงไม่เปลี่ยนแปลง การเปิดสถานะซื้อ

Miroslaw Bawulski 15:29 2025-07-03 UTC+2

วิธีการซื้อขายคู่สกุลเงิน GBP/USD ในวันที่ 3 กรกฎาคม? เคล็ดลับง่ายๆ และการวิเคราะห์การซื้อขายสำหรับผู้เริ่มต้น

ในวันพุธ คู่สกุลเงิน GBP/USD ร่วงหล่นเหมือนก้อนหินที่ถูกปล่อยจากยอดตึกระฟ้า ทำให้นักวิเคราะห์สกุลเงินต้องค้นหาสาเหตุของการตกลงอย่างฉับพลันนี้ทันที อย่างไรก็ตาม เรามีมุมมองที่ต่างไปต่อการเคลื่อนไหวของตลาดในลักษณะนี้: ไม่ใช่ทุกครั้งจะมีเหตุผลที่ชัดเจน ปอนด์อังกฤษได้ขึ้นมาเป็นเวลานานและได้มีสถานะ Overbought และมีผู้ทำตลาดในตลาดเพียงพอที่ล่าหาสภาพคล่องจากนักเทรดรายย่อย ดังนั้นจึงเป็นไปได้ว่าที่เราเห็นเป็นการตกที่อาจนำไปสู่การฟื้นตัวใหม่ของสกุลเงินอังกฤษได้ เราไม่เห็นเหตุผลที่จะทำให้ปอนด์ดิ่งลงอย่างเฉียบพลัน "อย่างไม่คาดคิด" วันนี้

Paolo Greco 06:53 2025-07-03 UTC+2

วิธีการซื้อขายคู่สกุลเงิน EUR/USD ในวันที่ 3 กรกฎาคม? เคล็ดลับง่ายๆ และการวิเคราะห์การซื้อขายสำหรับมือใหม่

ในวันพุธ คู่สกุลเงิน EUR/USD พยายามเริ่มรอบใหม่ของการแก้ไขขาลง และผลของความพยายามนี้สามารถเห็นได้ในทุกกรอบเวลาที่ใช้ ดังนั้นการแข็งค่าของดอลลาร์สหรัฐ แม้จะเพิ่มขึ้น แต่ก็นับว่าเป็นการแข็งค่าที่อ่อนแอและเกิดขึ้นในช่วงเวลาสั้น ๆ สิ่งที่น่าสังเกตคือ การเคลื่อนไหวของ EUR/USD เมื่อวานนี้สามารถผูกโยงกับปัจจัยพื้นฐานทางเศรษฐกิจมหภาคได้อย่างง่ายดาย ซึ่งอย่างไรก็ตาม ภูมิหลังทางเศรษฐกิจมหภาคนี้ยังคงอ่อนแอ

Paolo Greco 06:33 2025-07-03 UTC+2

คำแนะนำและการวิเคราะห์การซื้อขายสำหรับ GBP/USD ในวันที่ 3 กรกฎาคม: การจัดการเพื่อการรณรงค์ครั้งใหม่?

ในวันพุธที่ผ่านมา คู่สกุลเงิน GBP/USD ตกลงอย่างฉับพลันโดยไม่มีเหตุผลที่ชัดเจน ไม่มีข่าวสำคัญใด ๆ ในสหราชอาณาจักรหรือสหรัฐที่อาจทำให้ค่าเงินปอนด์สเตอริงค์ลดลงเกือบ 200 จุด แต่จากมุมมองทางเทคนิคแล้ว ราคาปรับฐานได้ดีและอยู่บนเส้น Senkou Span B หลังจากที่มีการปรับตัวขึ้นอย่างแข็งแกร่ง

Paolo Greco 03:45 2025-07-03 UTC+2
หากไม่สะดวกคุยในตอนนี้
ระบุคำถามไว้ได้ใน แชท.
Widget callback
 

Dear visitor,

Your IP address shows that you are currently located in the USA. If you are a resident of the United States, you are prohibited from using the services of InstaFintech Group including online trading, online transfers, deposit/withdrawal of funds, etc.

If you think you are seeing this message by mistake and your location is not the US, kindly proceed to the website. Otherwise, you must leave the website in order to comply with government restrictions.

Why does your IP address show your location as the USA?

  • - you are using a VPN provided by a hosting company based in the United States;
  • - your IP does not have proper WHOIS records;
  • - an error occurred in the WHOIS geolocation database.

Please confirm whether you are a US resident or not by clicking the relevant button below. If you choose the wrong option, being a US resident, you will not be able to open an account with InstaForex anyway.

We are sorry for any inconvenience caused by this message.