empty
04.01.2022 01:03 PM
Technical analysis recommendations of EUR/USD and GBP/USD on January 4, 2021

EUR/USD

This image is no longer relevant

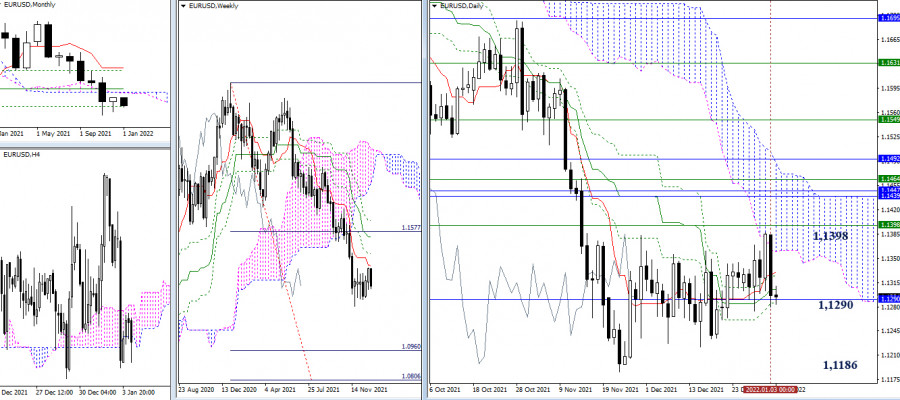
The bulls tried to develop corrective prerequisites in the last days of the past year. However, its rival returned the situation to the center of the current consolidation of 1.1290 (monthly Fibo Kijun + daily cross) on the very first trading day of the new year. As a result, it can be noted that the area of 1.1383-87-98 (highs + weekly short-term trend) now serves as the upward border of the long-term movement that has formed the uncertainty. The downward target is the minimum extremum of the movement at 1.1186.

This image is no longer relevant

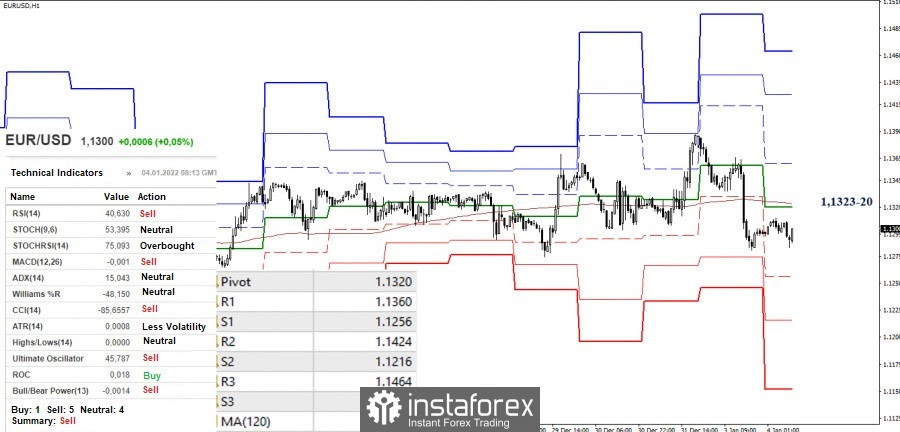
The advantage in the smaller timeframes is currently on the bearish side, as the pair is below the key levels, which are joining forces around 1.1323-20 (weekly long-term trend + central pivot level). The support for the classic pivot levels (1.1256 - 1.1216 - 1.1152) acts as pivot points for the continuation of the decline. In turn, a consolidation above the level of 1.1323-20 can change the current balance of forces in favor of the bulls. In this case, the pivot points will be the resistances of the classic pivot levels (1.1360 - 1.1424 - 1.1464).

GBP/USD

This image is no longer relevant

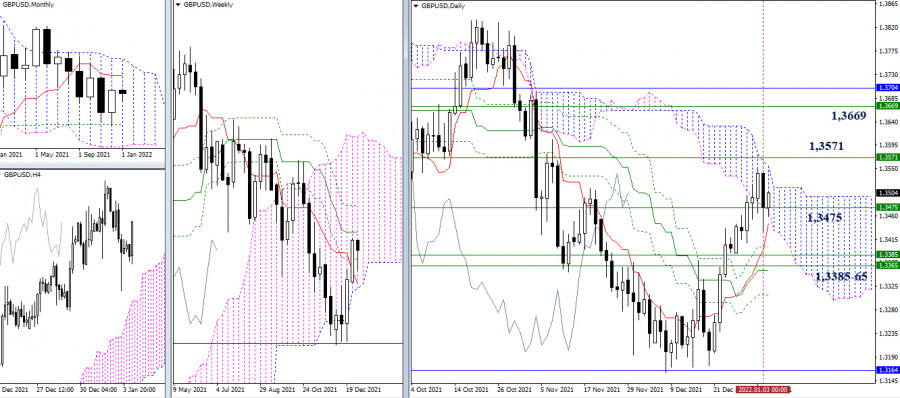
The bulls managed to close December very optimistically indicating a rebound from the tested support level of 1.3164 (monthly Fibo Kijun). In addition, the pair confirmed the consolidation in the weekly cloud after an attempt to break through its lower border. It should also be noted that trading is now underway to test the resistance of the daily Ichimoku cloud. Its breakdown and reliable consolidation above will form an upward target.

The implementation of the target will allow us to break through the weekly dead cross, whose levels are now the closest resistances and targets for bullish traders – 1.3571 (Kijun) and 1.3669 (Fibo Kijun). The main support levels here are formed by combinations of daily and weekly levels, among them the borders of 1.3475 and 1.3385-65 can be distinguished.

This image is no longer relevant

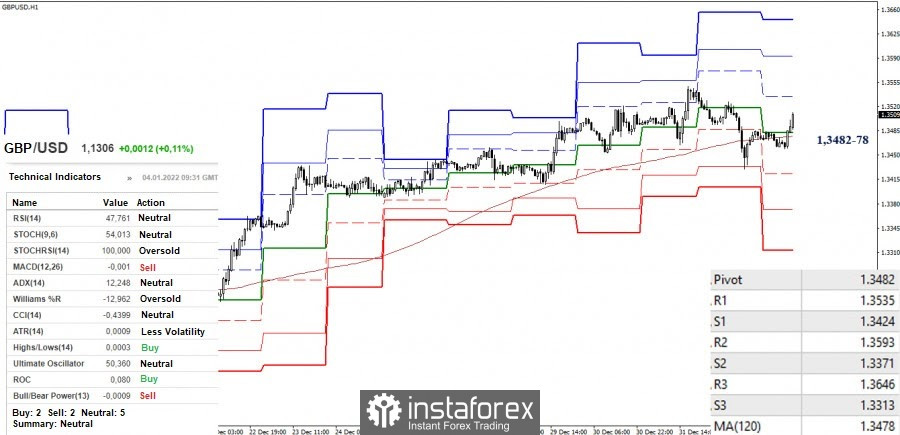
There is currently a struggle for the key levels of 1.3482-78 (central pivot level + weekly long-term trend) in the smaller timeframes, so the situation is still largely neutral. A reliable consolidation above the key levels will favor the bulls. The pivot points for further growth will be the resistance of the classic pivot levels (1.3535 - 1.3593 - 1.3646). On the contrary, the return of the bearish mood will allow us to consider the support of the classic pivot levels (1.3424 - 1.3371 - 1.3313).

***

Ichimoku Kinko Hyo (9.26.52) and Kijun-sen levels in the higher time frames, as well as classic Pivot Points and Moving Average (120) on the H1 chart, are used in the technical analysis of the trading instruments.

เลือกช่วงเวลา
5
นาที
15
นาที
30
นาที
1
ชั่วโมง
4
ชั่วโมง
1
วัน
1
สัปดาห์
รับผลกำไรจากการเปลี่ยนแปลงอัตราสกุลเงินดิจิทัลกับ InstaForex.
ดาวน์โหลด MetaTrader 4 และเปิดการซื้อขายครั้งแรกของคุณ.
GBP/JPY: การวิเคราะห์ การคาดการณ์ และสถานการณ์ตลาดปัจจุบัน เมื่อวันพฤหัสบดี คู่สกุลเงิน GBP/JPY ได้รับแรงหนุนให้กลับมาสู่แนวโน้มขาขึ้นอีกครั้งและแสดงสัญญาณความพร้อมสำหรับการขยายตัวต่อไป การก่อตัวของช่องทางขาขึ้นยืนยันถึงความมั่นคงของแนวโน้มขาขึ้นนี้ ในช่วงการซื้อขายเอเชีย ผู้ซื้อมีความกระตือรือร้นมากขึ้นใกล้ระดับ 198.40–198.35 ซึ่งช่วยจำกัดการปรับตัวลดลงจากระดับสูงสุดของปีที่เคยถึงในช่วงก่อนหน้า คู่สกุลเงินนี้ปัจจุบันเคลื่อนที่อยู่รอบระดับจิตวิทยาที่ 199.00 และยังคงมีแนวโน้มขาขึ้น ในช่วงสองเดือนที่ผ่านมา คู่สกุลเงินนี้เคลื่อนที่ภายในช่องทางขาขึ้นซึ่งบ่งบอกถึงการเติบโตอย่างต่อเนื่อง ตัววัดสัญญาณออสซิลเลเตอร์ในกราฟรายวันยังคงอยู่ในดินแดนบวกและยังไม่เข้าสู่สภาวะที่ซื้อมากเกินไป
  • Grand Choice
    Contest by
    InstaForex
    InstaForex always strives to help you
    fulfill your biggest dreams.
    เข้าร่วมการแข่งขัน


บทความแนะนำ

GBP/JPY: การวิเคราะห์ การคาดการณ์ และสถานการณ์ตลาดปัจจุบัน

เมื่อวันพฤหัสบดี คู่สกุลเงิน GBP/JPY ได้รับแรงหนุนให้กลับมาสู่แนวโน้มขาขึ้นอีกครั้งและแสดงสัญญาณความพร้อมสำหรับการขยายตัวต่อไป การก่อตัวของช่องทางขาขึ้นยืนยันถึงความมั่นคงของแนวโน้มขาขึ้นนี้ ในช่วงการซื้อขายเอเชีย ผู้ซื้อมีความกระตือรือร้นมากขึ้นใกล้ระดับ 198.40–198.35 ซึ่งช่วยจำกัดการปรับตัวลดลงจากระดับสูงสุดของปีที่เคยถึงในช่วงก่อนหน้า คู่สกุลเงินนี้ปัจจุบันเคลื่อนที่อยู่รอบระดับจิตวิทยาที่ 199.00 และยังคงมีแนวโน้มขาขึ้น ในช่วงสองเดือนที่ผ่านมา คู่สกุลเงินนี้เคลื่อนที่ภายในช่องทางขาขึ้นซึ่งบ่งบอกถึงการเติบโตอย่างต่อเนื่อง ตัววัดสัญญาณออสซิลเลเตอร์ในกราฟรายวันยังคงอยู่ในดินแดนบวกและยังไม่เข้าสู่สภาวะที่ซื้อมากเกินไป

Irina Yanina 10:22 2025-07-10 UTC+2

หากแนวต้านที่ระดับ 0.7964 สามารถหยุดยั้งการเคลื่อนไหวขึ้นได้ USD/CHF มีแนวโน้มที่จะอ่อนตัวลงในวันพฤหัสบดีที่ 10 กรกฎาคม 2025

USD/CHF, วันพฤหัสบดีที่ 10 กรกฎาคม 2025 นอกจากข่าวลือเกี่ยวกับการตัดสินใจลดอัตราดอกเบี้ยของ Fed และการลดลงของอัตราดอกเบี้ยพันธบัตรรัฐบาลสหรัฐ USD/CHF ลดลงในวันนี้ ระดับที่สำคัญ 1. แนวต้าน 2: 0.7990

Arief Makmur 06:47 2025-07-10 UTC+2

ค่าเงินปอนด์อาจมีศักยภาพในการทดสอบระดับ Pivot และ Support 1 ได้ในอนาคตอันใกล้ในวันพฤหัสบดีที่ 10 กรกฎาคม 2025

GBP/USD, วันพฤหัสบดีที่ 10 กรกฎาคม 2025 ข่าวลือเกี่ยวกับนโยบายการเงินผ่อนคลายของ Fed ในอนาคตได้สร้างความรู้สึกเชิงลบต่อ USD ซึ่งอาจช่วยให้เงินปอนด์อังกฤษแข็งค่าอีกครั้งในวันนี้ ระดับสำคัญ 1. ระดับต้านทานที่ 2: 1.3642

Arief Makmur 06:47 2025-07-10 UTC+2

การคาดการณ์ EUR/USD สำหรับวันที่ 10 กรกฎาคม 2025

ตลาดยังคงทดสอบกลยุทธ์ความเสี่ยงที่สูงขึ้น เมื่อวานนี้ S&P 500 เพิ่มขึ้น 0.61% ราคาน้ำมันลดลง 0.22% และยูโรลดลงเพียง 4 จุด ซึ่งเมื่อพิจารณาจากความผันผวนในแต่ละวันที่ต่ำ สามารถถือว่าเป็นผลลัพธ์ที่เป็นกลาง หลังจากดีดตัวกลับจากระดับ 1.1692

Laurie Bailey 06:14 2025-07-10 UTC+2

สัญญาณการซื้อขายสำหรับทองคำ (XAU/USD) ระหว่างวันที่ 10-15 กรกฎาคม 2025: แนะนำขายหากต่ำกว่า $3,330 (21 SMA - 200 EMA)

ในช่วงต้นของการซื้อขายยุโรป ทองคำอยู่ที่ประมาณ 3,317 ซึ่งกลับมาเพิ่มขึ้นหลังจากที่ร่วงลงต่ำสุดที่ 3,281 ขณะนี้กำลังมุ่งสู่ระดับแนวต้าน ช่วง 3,330-3,360 ได้พิสูจน์แล้วว่าเป็นแนวต้านที่แข็งแกร่งสำหรับทองคำในอดีต ดังนั้นเราจึงเชื่อว่าหากต่ำกว่า 3,330 ทองคำควรต้องมีการปรับฐานทางเทคนิคและอาจไปถึงแนวรับที่ 3,281 และ 3,242

Dimitrios Zappas 06:10 2025-07-10 UTC+2

สัญญาณการซื้อขายสำหรับ EUR/USD ระหว่างวันที่ 10-15 กรกฎาคม 2025: ขายต่ำกว่า 1.1753 (200 EMA - +1/8 Murray)

ในช่วงต้นของเซสชันยุโรป ยูโรมีการซื้อขายอยู่ราว ๆ 1.1737 ซึ่งสูงกว่าค่าเฉลี่ยเคลื่อนที่ 21 วัน และกำลังพยายามที่จะทะลุแนวต้านของช่องแนวโน้มขาลงที่เกิดขึ้นตั้งแต่ปลายเดือนมิถุนายน หากแรงซื้อยังคงมีอยู่และยูโรสามารถยืนเหนือ 1.1753 ได้ เราอาจคาดหวังว่าอาจจะมีวัฏจักรขาขึ้นใหม่ และยูโรอาจไปถึงระดับ +1/8

Dimitrios Zappas 06:08 2025-07-10 UTC+2

การคาดการณ์ค่าเงิน GBP/USD สำหรับวันที่ 10 กรกฎาคม 2025

ค่าเงินปอนด์ของอังกฤษกำลังค่อยๆ เข้าใกล้แนวต้านเป้าหมายที่ 1.3635 หากสามารถทะลุผ่านระดับนี้ได้จะเปิดทางไปยังเส้น MACD ที่ 1.3705 เป้าหมายนี้มีแนวโน้มที่จะบรรลุผลสำเร็จได้ เนื่องจาก Marlin oscillator กำลังเพิ่มขึ้นนำหน้าราคาอยู่ในขณะนี้และจะเข้าสู่แดนบวกในไม่ช้า เมื่อถึงตอนนั้นมันจะให้แรงส่งเพิ่มเติมแก่ราคาเพื่อเอาชนะระดับ 1.3635 การพุ่งทะลุเหนือเส้น

Laurie Bailey 05:53 2025-07-10 UTC+2

การคาดการณ์ค่าเงิน AUD/USD สำหรับวันที่ 10 กรกฎาคม 2025

AUD/USDในแผนภูมิรายวัน ออสซิลเลเตอร์ Marlin ยังคงเคลื่อนไหวอย่างยืดเยื้อไปตามเส้นศูนย์ที่เป็นกลาง เมื่อราคาทะลวงผ่านระดับความต้านทานหรือการสนับสนุนใหม่ๆ ที่ระดับท้องถิ่น มันจะเจอกับอุปสรรคใหม่ ระดับสำคัญถัดไปคือตอนนี้เส้นขอบบนของช่องราคาที่บริเวณใกล้ 0.6596 การรวมตัวเหนือระดับนี้จะเปิดทางไปสู่เป้าหมายที่ 0.6650 ออสซิลเลเตอร์ Marlin ยังคงอยู่ในโซนบวกและกำลังเพิ่มขึ้น ซึ่งบ่งบอกว่าเส้นสีเขียวของช่องราคาน่าจะถูกทำลาย—โดยเฉพาะอย่างยิ่งเมื่อเส้น

Laurie Bailey 05:42 2025-07-10 UTC+2

สัญญาณการซื้อขายสำหรับทองคำ (XAU/USD) ระหว่างวันที่ 9-12 กรกฎาคม 2025: แนะนำให้ขายที่ต่ำกว่า $3,330 (21 SMA - 200 EMA)

ในช่วงเช้าของการซื้อขายในสหรัฐฯ ราคาทองคำอยู่ที่ประมาณ 3,309 ดอลลาร์ กลับตัวหลังจากแตะจุดต่ำสุดของแนวโน้มขาลงที่เกิดขึ้นเมื่อวันที่ 30 มิถุนายน ที่ประมาณ 3,281 ดอลลาร์ โซนนี้ถือเป็นแนวรับที่ดีสำหรับทองคำ โลหะมีอาจจะ continue ปรับตัวขึ้นในชั่วโมงถัดไป ไปถึง

Dimitrios Zappas 19:56 2025-07-09 UTC+2

สัญญาณการเทรดสำหรับ EUR/USD ประจำวันที่ 9-12 กรกฎาคม 2025: ขายต่ำกว่า 1.1745 (21 SMA - 8/8 Murray)

ในช่วงต้นของการซื้อขายสหรัฐอเมริกา เงินยูโรกำลังซื้อขายที่ประมาณ 1.1714 มีการดีดตัวขึ้นเนื่องจากแรงกดดันขาลงที่แข็งแกร่ง ซึ่งมีแนวโน้มจะพบกับความยากลำบากเมื่อเข้าใกล้เส้น 21SMA ที่ 1.1737 หรือบริเวณยอดของช่องแนวโน้มขาลงที่ 1.1740 เงินยูโรอาจร่วงลงอย่างมากหากยืนอยู่ใต้ระดับ 8/8 Murray ที่ 1.1718

Dimitrios Zappas 19:54 2025-07-09 UTC+2
หากไม่สะดวกคุยในตอนนี้
ระบุคำถามไว้ได้ใน แชท.
Widget callback
 

Dear visitor,

Your IP address shows that you are currently located in the USA. If you are a resident of the United States, you are prohibited from using the services of InstaFintech Group including online trading, online transfers, deposit/withdrawal of funds, etc.

If you think you are seeing this message by mistake and your location is not the US, kindly proceed to the website. Otherwise, you must leave the website in order to comply with government restrictions.

Why does your IP address show your location as the USA?

  • - you are using a VPN provided by a hosting company based in the United States;
  • - your IP does not have proper WHOIS records;
  • - an error occurred in the WHOIS geolocation database.

Please confirm whether you are a US resident or not by clicking the relevant button below. If you choose the wrong option, being a US resident, you will not be able to open an account with InstaForex anyway.

We are sorry for any inconvenience caused by this message.