empty
25.01.2022 07:56 PM
Analysis of GBP/USD on January 25. The British stopped before the 1.3455 mark and are waiting for the FOMC meeting.

This image is no longer relevant

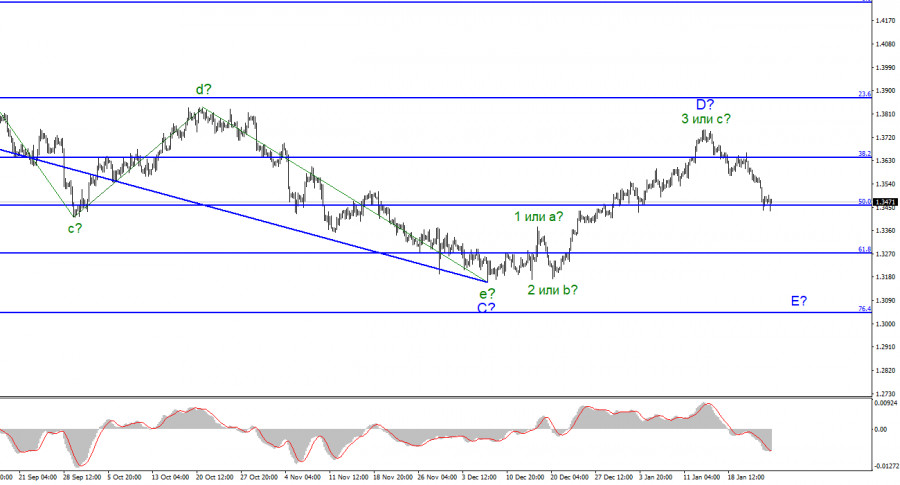
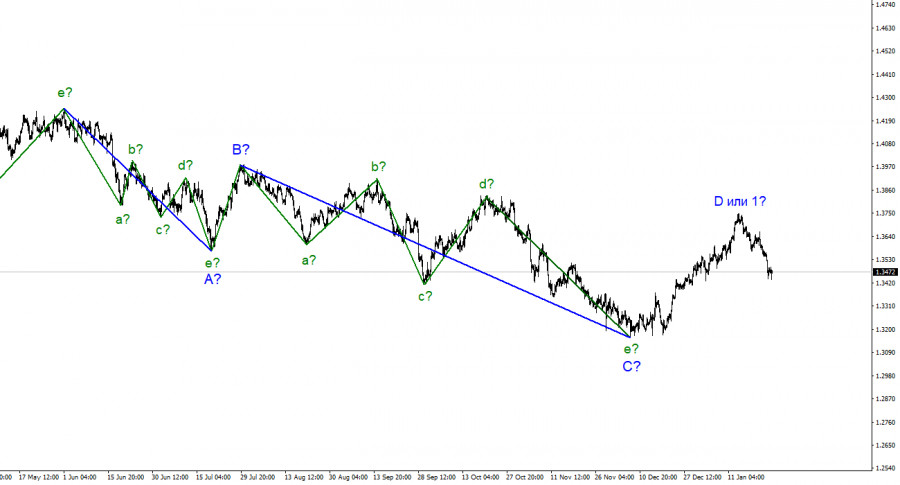
For the Pound/Dollar instrument, the wave markup continues to look quite convincing. In the last few weeks, the instrument has continued to build an upward wave, which is currently interpreted as wave D of the downward trend segment. If the current wave marking is correct, then this wave has completed its construction and the construction of wave E has begun. Thus, the entire downward section of the trend may take on an even more extended form. Wave D has taken a clear three-wave form and its internal wave marking does not cause any questions now. A successful attempt to break through the 1.3644 mark, which corresponds to 38.2% Fibonacci, indicates that the markets are ready to sell the British. A successful attempt to break through the 50.0% level may cause increased sales of the British. Correction waves are not visible at all inside the supposed wave E, which leads to the conclusion about its possible very extended appearance. Thus, both the euro and the pound may significantly sink in price in the coming months.

Moving away from the topic of Boris Johnson and focusing on the FOMC meeting.

The exchange rate of the Pound/Dollar instrument decreased by 50 basis points during January 25, but in the afternoon it managed to add about the same amount in price. Thus, the scenario of the previous day was completely repeated, when the demand for the US currency grew for most of it, but by the end of the day, the situation changed slightly towards the British. However, the Briton is still not in his best position right now. If the current wave marking is correct, then its decline will continue with targets located below the previous low mark of 1.3159. This means that the instrument may lose at least 300 more points in the coming weeks. Tomorrow's Fed meeting can help him in this. As I said in my review of the Euro/Dollar instrument, there is a high probability that the demand for the US currency will grow tomorrow against the background of the FOMC decisions. Most likely, Jerome Powell will also take a "hawkish" position, which will further assure the market of the inevitability of a rate hike in 2022. But the meeting of the Bank of England will take place a little later, so the Briton will have "nothing to cover" tomorrow. Although he already had the opportunity to have his say last week, when various reports were published only in the UK. Unfortunately, not all of them could support the demand for the pound and not all of them were interested in the market at all. In the same week, all the most interesting things will happen in the USA. Today, the news background was also only in America. The consumer confidence indicator in January was 113.8, which is slightly better than market expectations. However, this report did not cause any reaction from the market. Yesterday, the dollar fell slightly against the background of weak business activity indices, but today it should have continued to increase. But this report was rather weak, and there were no others today. As in the case of the Euro/Dollar instrument, I believe that the wave marking is in the first place now, and the news background is in second place.

General conclusions.

The wave pattern of the Pound/Dollar instrument assumes the construction of an assumed E wave. A successful attempt to break through the 1.3458 mark will allow you to continue selling the instrument with targets located near the estimated 1.3271 mark, which corresponds to 61.8% Fibonacci. I am not considering alternative options right now, as there is no reason for this. The E wave can get a clear five-wave structure.

This image is no longer relevant

Chin Zhao,
ผู้เชี่ยวชาญด้านการวิเคราะห์ของ InstaForex
© 2007-2025
Summary
Urgency
Analytic
Alexander Dneprovskiy
Start trade
รับผลกำไรจากการเปลี่ยนแปลงอัตราสกุลเงินดิจิทัลกับ InstaForex.
ดาวน์โหลด MetaTrader 4 และเปิดการซื้อขายครั้งแรกของคุณ.
คำแนะนำในการเทรดและการชำแหละการซื้อขายสำหรับ GBP/USD วันที่ 15 กรกฎาคม: ปอนด์อังกฤษแสดงถึงความอ่อนแอ คู่สกุลเงิน GBP/USD ยังคงเคลื่อนไหวในแนวโน้มขาลงตลอดวันจันทร์ แม้ว่าจะไม่มีข่าวเศรษฐกิจมหภาคจากทั้งสหราชอาณาจักรและสหรัฐฯ แต่ตลาดยังคงหาทางขายเงินปอนด์อังกฤษได้อีก เป็นการยากที่จะระบุถึงเหตุผลว่าเกิดจากอะไรเนื่องจากพื้นฐานยังคงเหมือนเดิมในทั้งสองคู่นี้ เราเชื่อว่ามันเป็นเพียงการปรับฐานทางเทคนิค คล้ายกับสิ่งที่เกิดขึ้นกับเงินยูโร ในกรอบเวลารายชั่วโมง การเคลื่อนไหวในแนวโน้มขาลงอาจดูรุนแรง แต่เมื่อเปลี่ยนไปดูกราฟรายวันจะพบว่าภาพที่เห็นนั้นไม่ตรงกับความเป็นจริง อย่างไรก็ตาม ช่องทางขาลงยังคงเป็นสิ่งสำคัญและราคายังอยู่ใต้เส้นบ่งชี้ Ichimoku ในจุดนี้ไม่มีเหตุผลที่จะคาดว่าการลดค่าของคู่เงินนี้จะกลับตัวได้
คำแนะนำการซื้อขายและวิเคราะห์การซื้อขายสำหรับ EUR/USD เมื่อวันที่ 15 กรกฎาคม: ยูโรติดอยู่ใกล้ระดับสำคัญ คู่สกุลเงิน EUR/USD เคลื่อนไหวในทิศทางขนานในวันจันทร์ตลอดทั้งวัน ในบทความก่อนหน้า เราได้คาดการณ์ว่าจะไม่มีการเคลื่อนไหวที่รุนแรงในวันซื้อขายแรกของสัปดาห์ เนื่องจากตลาดได้เพิกเฉยต่อนโยบายภาษีนำเข้าใหม่ที่ Donald Trump ได้ออกมาในสัปดาห์ก่อน และไม่มีรายงานเศรษฐกิจมหภาคที่มีกำหนดในวันนั้น ด้วยเหตุนี้ แม้การกำหนดภาษีใหม่ของประธานาธิบดีสหรัฐฯ ก็ไม่ได้ให้เหตุผลให้เราคาดหวังถึงความผันผวนสูง ถึงแม้ว่าภาษีนำเข้าใหม่นั้นจะไม่สามารถถูกละเลยได้ โดยเฉพาะเมื่อเราคิดว่าตลาดจะตอบสนองกับมาตรการนี้ในที่สุด
  • Grand Choice
    Contest by
    InstaForex
    InstaForex always strives to help you
    fulfill your biggest dreams.
    เข้าร่วมการแข่งขัน


บทความแนะนำ

วิเคราะห์ GBP/USD – 14 กรกฎาคม ดอลลาร์ค้นพบเหตุผลใหม่ในการเฉลิมฉลอง

รูปแบบคลื่นสำหรับคู่สกุลเงิน GBP/USD ยังบ่งชี้ถึงการเกิดโครงสร้างคลื่นแรงกระตุ้นที่มีแนวโน้มขึ้น รูปคลื่นนั้นเกือบจะเหมือนกับของ EUR/USD เพราะว่าเงินดอลลาร์สหรัฐยังคงเป็นผู้เล่นหลักในตลาด ความต้องการสำหรับเงินดอลลาร์กำลังลดลงทั่วทั้งกระดาน ส่งผลให้มีพลวัตที่คล้ายกันในเครื่องมือต่างๆ คลื่นที่ 2 ของเทรนด์แนวโน้มขึ้นเกิดในรูปแบบคลื่นเดียว คลื่นที่ 3 ที่สมมุติไว้ได้เกิดขึ้นชัดเจนและแล้วเสร็จแล้ว ดังนั้นฉันคาดว่าจะมีการสร้างโครงสร้างการแก้ไขตามมา

Chin Zhao 22:23 2025-07-14 UTC+2

วิเคราะห์ EUR/USD – 14 กรกฎาคม สัปดาห์นี้เริ่มต้นไม่ดี

รูปแบบคลื่นในกราฟ 4 ชั่วโมงของเครื่องมือ EUR/USD ไม่ได้เปลี่ยนแปลงมาหลายเดือน ส่วนแนวโน้มขาขึ้นยังคงพัฒนาอย่างต่อเนื่อง และข่าวพื้นฐานยังคงสนับสนุนทุกสกุลเงินยกเว้นดอลลาร์สหรัฐ สงครามการค้าที่ Donald Trump เริ่มต้นขึ้นมีเป้าหมายเพื่อเพิ่มรายได้งบประมาณและขจัดการขาดดุลการค้า อย่างไรก็ตาม เป้าหมายเหล่านี้ยังไม่บรรลุผล ข้อตกลงทางการค้ากำลังถูกลงนามด้วยความยากลำบาก

Chin Zhao 22:19 2025-07-14 UTC+2

การคาดการณ์รายสัปดาห์โดยใช้การวิเคราะห์คลื่นแบบง่ายสำหรับ GBP/USD, AUD/USD, USD/CHF, EUR/JPY, AUD/JPY และดัชนีดอลลาร์สหรัฐ ณ วันที่ 14 กรกฎาคม

GBP/USD การวิเคราะห์: คลื่นขาขึ้นที่เริ่มต้นตั้งแต่เดือนมกราคมของปีนี้ได้เข้าสู่ช่วงการปรับฐาน ตั้งแต่ปลายเดือนที่แล้ว ราคายังคงดึงกลับจากขอบล่างของเขตกลับตัวที่แข็งแกร่งที่มีศักยภาพในตัวเองได้ บริเวณแนวรับคำนวณไว้ที่ขอบบนของเขตแนวรับใน time frame 4 ชั่วโมง การคาดการณ์: การเคลื่อนไหวแบบ Sideways คาดว่าจะเกิดขึ้นตลอดทั้งสัปดาห์ ช่วงต้นสัปดาห์อาจเห็นแนวโน้มลงไปยังแนวรับ

Isabel Clark 11:12 2025-07-14 UTC+2

การพยากรณ์รายสัปดาห์โดยใช้การวิเคราะห์คลื่นแบบง่ายสำหรับ EUR/USD, USD/JPY, GBP/JPY, USD/CAD, NZD/USD, และทองคำ ณ วันที่ 14 กรกฎาคม

EUR/USD การวิเคราะห์: แนวคลื่นขาขึ้นที่เริ่มต้นตั้งแต่เดือนกุมภาพันธ์ยังคงดำเนินต่อไปในกราฟของคู่เงินยูโรหลัก สองสัปดาห์ที่แล้ว ราคามีการถอยกลับจากขอบล่างของโซนแนวต้านที่แข็งแกร่ง เมื่อเฟสขาลงเสร็จสิ้นแล้ว คาดว่าราคาจะกลับมาเติบโตอีกครั้ง การพยากรณ์: แนวการเคลื่อนที่ด้านข้างคาดว่าจะยังคงดำเนินต่อไปในสัปดาห์หน้า คู่นี้อาจมีแนวโน้มขาลงไปยังโซนแนวรับในช่วงวันแรกๆ ก่อนที่จะมีการกลับทิศทางและเคลื่อนไหวขึ้นอีกครั้ง การเปลี่ยนทิศทางอาจส่งผลให้เกิดความผันผวนเพิ่มขึ้น โซนกลับตัวที่มีศักยภาพ แนวต้าน: 1.1810

Isabel Clark 10:57 2025-07-14 UTC+2

การวิเคราะห์ GBP/USD วันที่ 10 กรกฎาคม 2025

รูปแบบคลื่นของคู่เงิน GBP/USD ยังคงบ่งบอกถึงการก่อตัวของโครงสร้างคลื่นขาขึ้น รูปแบบคลื่นนี้คล้ายกับคู่เงิน EUR/USD อย่างมาก เนื่องจากเงินดอลลาร์ยังคงเป็นตัวขับเคลื่อนหลักของการเคลื่อนไหวในตลาด ความต้องการเงินดอลลาร์สหรัฐอ่อนแอลงในทุกภาคส่วนของตลาด ส่งผลให้เกิดการเปลี่ยนแปลงแบบเดียวกันในเครื่องมือทางการเงินหลายตัว คลื่นที่ 2 ของแนวโน้มขาขึ้นมีลักษณะเป็นคลื่นเดี่ยว ภายในสมมติฐานของคลื่นที่ 3 ได้มีการก่อตัวของคลื่นย่อยที่

Chin Zhao 21:36 2025-07-10 UTC+2

การวิเคราะห์ EUR/USD วันที่ 10 กรกฎาคม 2025

รูปแบบคลื่นในกราฟ EUR/USD ราย 4 ชั่วโมงไม่เปลี่ยนแปลงมาหลายเดือนต่อเนื่อง การก่อตัวของแนวโน้มขาขึ้นยังคงดำเนินต่อไป ซึ่งพื้นฐานข่าวยังคงสนับสนุนทุกสกุลเงินยกเว้นดอลลาร์ สงครามการค้าที่ Donald Trump เริ่มนั้นมุ่งให้รายได้จากงบประมาณเพิ่มขึ้นและลดขาดดุลการค้า อย่างไรก็ตาม เป้าหมายเหล่านี้ยังไม่บรรลุข้อตกลงการค้าที่ยังลงนามได้ยาก และกฎหมาย "One

Chin Zhao 21:33 2025-07-10 UTC+2

การวิเคราะห์ GBP/USD ในวันที่ 9 กรกฎาคม 2025

รูปแบบคลื่นสำหรับ GBP/USD ยังคงบ่งบอกถึงการก่อตัวของรูปแบบคลื่นกระตุ้นที่มีแนวโน้มขึ้น ภาพคลื่นมีลักษณะคล้ายกับ EUR/USD เป็นอย่างมาก เนื่องจากดอลลาร์สหรัฐยังคงเป็นปัจจัยขับเคลื่อนเดียวในช่วงที่ผ่านมา ความต้องการดอลลาร์กำลังลดลงทั่วทุกตลาด จึงทำให้อุปกรณ์ทางการเงินหลายอย่างแสดงพฤติกรรมที่คล้ายคลึงกัน คลื่นที่ 2 ของแนวโน้มขาขึ้นได้มีลักษณะเป็นคลื่นเดี่ยว ภายในคลื่นที่ 3 ที่สมมติไว้

Chin Zhao 21:01 2025-07-09 UTC+2

การวิเคราะห์ EUR/USD ในวันที่ 9 กรกฎาคม 2025

รูปแบบคลื่นในกราฟ 4 ชั่วโมงสำหรับคู่เงิน EUR/USD ยังไม่มีการเปลี่ยนแปลงติดต่อกันเป็นเวลาหลายเดือน การสร้างแนวโน้มขาขึ้นยังคงดำเนินต่อไป ขณะที่แบ็คกราวน์ข่าวยังคงสนับสนุนทุกสกุลเงิน ยกเว้น ดอลลาร์ สงครามการค้าเริ่มโดย Donald Trump เพื่อหวังเพิ่มรายได้งบประมาณและลดการขาดดุลการค้า อย่างไรก็ตามเป้าหมายเหล่านี้ยังไม่สำเร็จ การเซ็นข้อตกลงการค้ามีความยากลำบาก

Chin Zhao 20:56 2025-07-09 UTC+2

วิเคราะห์ EUR/USD ประจำวันที่ 8 กรกฎาคม 2025

รูปแบบคลื่นในกราฟ EUR/USD ระดับ 4 ชั่วโมง มีความสม่ำเสมอเป็นระยะเวลาหลายเดือนแล้ว ส่วนแนวโน้มขาขึ้นยังคงก่อตัว และสถานการณ์ข่าวสนับสนุนค่าเงินทั้งหมดยกเว้นดอลลาร์สหรัฐ สงครามการค้าที่ Donald Trump เป็นผู้ริเริ่ม มีเป้าหมายเพื่อเพิ่มรายได้งบประมาณและลดการขาดดุลการค้า แต่เป้าหมายเหล่านี้ยังไม่บรรลุผล การทำข้อตกลงทางการค้าเป็นไปอย่างเชื่องช้า

Chin Zhao 20:00 2025-07-08 UTC+2

การวิเคราะห์ GBP/USD วันที่ 8 กรกฎาคม 2025

รูปแบบคลื่นสำหรับ GBP/USD ยังคงบ่งชี้ถึงการเกิดโครงสร้างคลื่นขาขึ้นที่แข็งแรง รูปแบบคลื่นนี้เกือบจะเหมือนกับของ EUR/USD เนื่องจากดอลลาร์สหรัฐยังคงเป็นตัวขับเคลื่อนหลัก ความต้องการซื้อดอลลาร์ลดลงทั่วตลาด ซึ่งเป็นสาเหตุที่หลายๆ เครื่องมือแสดงถึงพลวัตที่คล้ายคลึงกัน คลื่น 2 ของแนวโน้มขาขึ้นได้มีรูปแบบคลื่นลูกเดียว ภายในคลื่นที่สันนิษฐานคือคลื่น 3 คลื่น

Chin Zhao 19:46 2025-07-08 UTC+2
หากไม่สะดวกคุยในตอนนี้
ระบุคำถามไว้ได้ใน แชท.
Widget callback
 

Dear visitor,

Your IP address shows that you are currently located in the USA. If you are a resident of the United States, you are prohibited from using the services of InstaFintech Group including online trading, online transfers, deposit/withdrawal of funds, etc.

If you think you are seeing this message by mistake and your location is not the US, kindly proceed to the website. Otherwise, you must leave the website in order to comply with government restrictions.

Why does your IP address show your location as the USA?

  • - you are using a VPN provided by a hosting company based in the United States;
  • - your IP does not have proper WHOIS records;
  • - an error occurred in the WHOIS geolocation database.

Please confirm whether you are a US resident or not by clicking the relevant button below. If you choose the wrong option, being a US resident, you will not be able to open an account with InstaForex anyway.

We are sorry for any inconvenience caused by this message.