empty
08.02.2022 07:29 PM
EUR/USD analysis on February 8. The market froze, there is no news

This image is no longer relevant

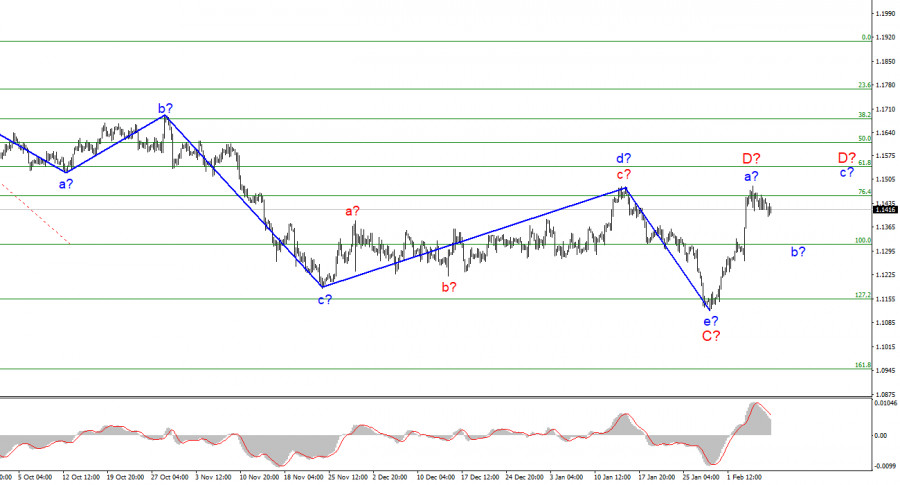
The wave marking of the 4-hour chart for the euro/dollar instrument has undergone certain changes, but nothing drastic. In the last week, a fairly strong increase in quotes continued. Thus, wave e-C is recognized as completed, since it turned out to be about the same size as the previous wave d-C. Therefore, the current upward wave is either D or 1. In the first case, the increase in the euro currency may already be completed. The picture below clearly shows that the correction wave B turned out to be shortened. The same can happen with wave D. An unsuccessful attempt to break through the 1.1455 mark, which corresponds to 76.4% Fibonacci, may become the second in recent weeks and lead to a departure of quotes from the reached highs, as well as to the end of the current wave. Thus, the wave marking now indicates a decline in quotes. And depending on how strong this decline will be, it will be possible to talk about which wave is being built now. The proposed wave D may turn out to be three-wave, but for now, this option looks like a backup.

The market can only wait for the US inflation report

The euro/dollar instrument fell by 30 basis points on Tuesday. Market activity remains very weak. The instrument continues its unhurried departure from the previously reached highs. Since the news background is now almost completely absent, the weak activity of the market does not raise any questions. In this case, if the market does not find reasons to trade more actively, it remains only to rely on those economic events that will take place this week. And the list here, I must say, is small. On Thursday, the US will release an inflation report for January. And perhaps that's all. I don't take into account those reports that the market reacts to once a year. But what can we expect from the inflation report? Forecasts suggest that this indicator will continue to grow and will amount to 7.3% y/y by the end of January. How will this affect the demand for the dollar? I believe that the only thing that can be expected with such a value of the indicator is a new increase in the US currency. There are two reasons for this. First, the wave markup now implies an increase in the dollar. Second, rising inflation will mean that the Fed will have to act even faster and even more aggressively in changing the parameters of monetary policy. The more inflation rises, the more difficult and longer it will be to bring it back to 2%, which is the "target" for the Fed. Therefore, I expect a slight decline in the instrument until Thursday, and on Thursday it may intensify. What will happen next largely depends on a successful or unsuccessful attempt to break through the 1.1314 mark, which corresponds to 100.0% Fibonacci.

General conclusions

Based on the analysis, I conclude that the construction of the ascending wave C is completed. However, wave D may already be completed too. If so, now is a good time to sell the European currency. At least with a target located near the 1.1314 mark. Another upward wave can be built inside wave D. And if the current wave is recognized not as D, but as 1 as part of a new upward trend segment, then a new upward wave is guaranteed to go beyond the peak of February 4. Thus, now cautious sales are ready for new purchases.

This image is no longer relevant

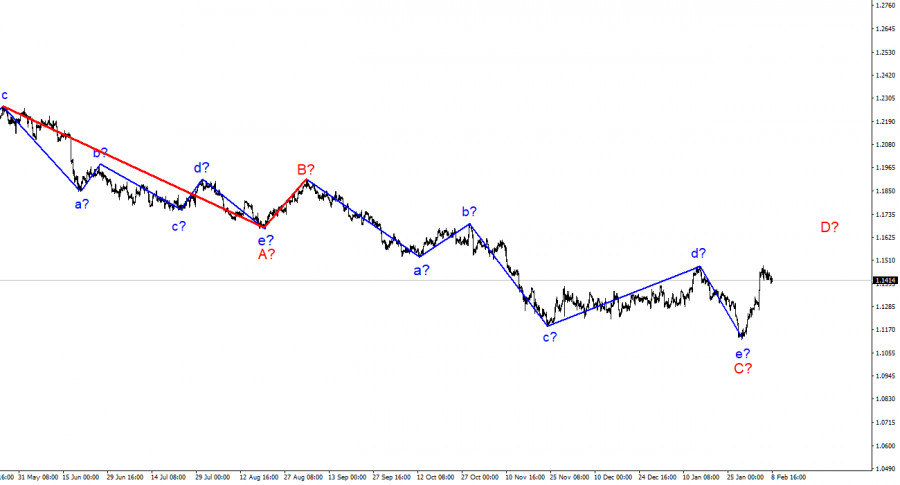
On a larger scale, it can be seen that the construction of the proposed wave D has now begun. This wave can be shortened or three-wave. Considering that all the previous waves were not too large and were approximately the same size, the same can be expected from the current wave. There are reasons to assume that wave D has already been completed, but a further increase in quotes will force us to reconsider this assumption.

Chin Zhao,
ผู้เชี่ยวชาญด้านการวิเคราะห์ของ InstaForex
© 2007-2025
Summary
Urgency
Analytic
Alexander Dneprovskiy
Start trade
รับผลกำไรจากการเปลี่ยนแปลงอัตราสกุลเงินดิจิทัลกับ InstaForex.
ดาวน์โหลด MetaTrader 4 และเปิดการซื้อขายครั้งแรกของคุณ.
  • Grand Choice
    Contest by
    InstaForex
    InstaForex always strives to help you
    fulfill your biggest dreams.
    เข้าร่วมการแข่งขัน


บทความแนะนำ

การวิเคราะห์ GBP/USD วันที่ 18 กรกฎาคม 2025

รูปคลื่นของ GBP/USD ยังคงบ่งชี้ถึงการสร้างรูปแบบคลื่นกระทิง รูปคลื่นมีลักษณะเกือบเหมือนกับ EUR/USD เพราะปัจจัยหลักที่ผลักดันตลาดในขณะนี้คือค่าเงินดอลลาร์สหรัฐ ความต้องการดอลลาร์กำลังลดลงในหลายๆ สาขา ซึ่งเป็นเหตุให้เครื่องมือหลายๆ ตัวมีแนวโน้มเหมือนกัน คลื่นที่ 2 ของแนวโน้มขาขึ้นมีลักษณะเป็นคลื่นเดียว คลื่นที่

Chin Zhao 21:34 2025-07-18 UTC+2

การวิเคราะห์ EUR/USD ในวันที่ 18 กรกฎาคม 2025

รูปแบบของคลื่นที่แสดงในกราฟ 4 ชั่วโมงของคู่สกุลเงิน EUR/USD ยังคงไม่เปลี่ยนแปลงมาหลายเดือนแล้ว การก่อตัวของเทรนด์สูงขึ้นยังคงดำเนินการต่อไป และข้อมูลข่าวสารยังคงสนับสนุนสกุลเงินทั้งหมดยกเว้นดอลลาร์ สงครามการค้าที่โดนัลด์ ทรัมป์เริ่มใช้เพื่-มรายได้งบประมาณและกำจัดผลประมุขการค้า แต่เป้าหมายเหล่านี้ยังไม่ได้บรรลุ: การตกลงทำธุรกิจเป็นไปได้ยาก และ "กฎหมายใหญ่เดียว" ของทรัมป์จะเพิ่มหนี้สินของสหรัฐฯ เป็นจำนวน

Chin Zhao 21:21 2025-07-18 UTC+2

การวิเคราะห์ EUR/USD วันที่ 17 กรกฎาคม 2025

รูปแบบคลื่นในกราฟ EUR/USD แบบ 4 ชั่วโมงยังคงไม่เปลี่ยนแปลงมาหลายเดือนติดต่อกัน ช่วงขาขึ้นของแนวโน้มยังคงพัฒนา ในขณะที่ฉากหลังของข่าวยังคงสนับสนุนทุกสกุลเงินยกเว้นดอลลาร์ สงครามการค้าซึ่ง Donald Trump เริ่มขึ้นเพื่อเพิ่มรายได้เข้ารัฐและขจัดการขาดดุลการค้า อย่างไรก็ตาม เป้าหมายเหล่านี้ยังไม่ประสบความสำเร็จ ข้อตกลงทางการค้าเป็นไปอย่างยากลำบาก และกฎหมาย

Chin Zhao 19:27 2025-07-17 UTC+2

การวิเคราะห์ GBP/USD วันที่ 16 กรกฎาคม 2025

รูปแบบคลื่นสำหรับคู่เงิน GBP/USD ยังคงชี้ให้เห็นถึงการก่อตัวของรูปแบบคลื่นแรงกระตุ้นที่เป็นขาขึ้น รูปแบบคลื่นนี้เกือบจะเหมือนกับรูปแบบของคู่เงิน EUR/USD เมื่อสกุลเงินดอลลาร์สหรัฐยังคงเป็นตัวขับเคลื่อนหลัก ความต้องการสกุลเงินดอลลาร์กำลังลดลงอย่างต่อเนื่อง ดังนั้นเครื่องมือหลายชนิดจึงแสดงพฤติกรรมที่คล้ายกัน คลื่นที่ 2 ของแนวโน้มขาขึ้นมาในรูปแบบของคลื่นเดี่ยว คลื่นที่ 3 ที่สันนิษฐานดูมีความเป็นไปได้และสมบูรณ์ ดังนั้นข้าพเจ้าคาดว่าจะเห็นการก่อตัวของโครงสร้างการแก้ไข

Chin Zhao 20:59 2025-07-16 UTC+2

การวิเคราะห์ EUR/USD ประจำวันที่ 16 กรกฎาคม 2025

รูปแบบของคลื่นบนกราฟ 4 ชั่วโมงสำหรับคู่สกุลเงิน EUR/USD ยังคงไม่เปลี่ยนแปลงเป็นเวลาหลายเดือนติดต่อกัน การก่อตัวของส่วนของแนวโน้มขาขึ้นยังคงดำเนินต่อไป และพื้นฐานข่าวยังคงสนับสนุนสกุลเงินทั้งหมด ยกเว้นดอลลาร์ สงครามการค้าโดย Donald Trump มีจุดประสงค์เพื่อเพิ่มรายได้งบประมาณและขจัดปัญหาการขาดดุลการค้า อย่างไรก็ตาม เป้าหมายเหล่านี้ยังไม่สมบูรณ์ข้อตกลงการค้าที่ได้รับการลงนามด้วยความยากลำบาก

Chin Zhao 20:57 2025-07-16 UTC+2

การวิเคราะห์ EUR/USD ประจำวันที่ 15 กรกฎาคม 2025

ลวดลายคลื่นในกราฟ 4 ชั่วโมงของคู่เงิน EUR/USD ยังคงไม่มีการเปลี่ยนแปลงมาหลายเดือนติดต่อกัน การสร้างส่วนของแนวโน้มขาขึ้นยังคงดำเนินต่อไป และผลข่าวยังคงสนับสนุนสกุลเงินทั้งหมด ยกเว้นดอลลาร์ สงครามการค้าที่ Donald Trump เริ่มต้นนั้นมีจุดประสงค์เพื่อเพิ่มรายได้ของรัฐบาลและกำจัดการขาดดุลการค้า อย่างไรก็ตามเป้าหมายเหล่านี้ยังไม่สำเร็จ: สัญญาการค้าถูกลงนามภายใต้แรงกดดัน

Chin Zhao 20:07 2025-07-15 UTC+2

การวิเคราะห์ GBP/USD ประจำวันที่ 15 กรกฎาคม 2025

รูปแบบคลื่นสำหรับ GBP/USD ยังคงแสดงถึงการก่อตัวของโครงสร้างคลื่นกระตุ้นที่พุ่งสูงขึ้น ตั้งค่าโครงสร้างคลื่นคล้ายกับของ EUR/USD เนื่องจากตัวขับเคลื่อนร่วมกันคือดอลลาร์สหรัฐ ความต้องการสำหรับดอลลาร์สหรัฐอ่อนแอลงทั่วทั้งตลาด ซึ่งทำให้เครื่องมือหลาย ๆ อย่างแสดงพฤติกรรมในลักษณะคล้ายกัน คลื่นที่ 2 ของแนวโน้มขาขึ้นมีรูปแบบเป็นคลื่นเดี่ยว คลื่น

Chin Zhao 19:56 2025-07-15 UTC+2

วิเคราะห์ GBP/USD – 14 กรกฎาคม ดอลลาร์ค้นพบเหตุผลใหม่ในการเฉลิมฉลอง

รูปแบบคลื่นสำหรับคู่สกุลเงิน GBP/USD ยังบ่งชี้ถึงการเกิดโครงสร้างคลื่นแรงกระตุ้นที่มีแนวโน้มขึ้น รูปคลื่นนั้นเกือบจะเหมือนกับของ EUR/USD เพราะว่าเงินดอลลาร์สหรัฐยังคงเป็นผู้เล่นหลักในตลาด ความต้องการสำหรับเงินดอลลาร์กำลังลดลงทั่วทั้งกระดาน ส่งผลให้มีพลวัตที่คล้ายกันในเครื่องมือต่างๆ คลื่นที่ 2 ของเทรนด์แนวโน้มขึ้นเกิดในรูปแบบคลื่นเดียว คลื่นที่ 3 ที่สมมุติไว้ได้เกิดขึ้นชัดเจนและแล้วเสร็จแล้ว ดังนั้นฉันคาดว่าจะมีการสร้างโครงสร้างการแก้ไขตามมา

Chin Zhao 22:23 2025-07-14 UTC+2

วิเคราะห์ EUR/USD – 14 กรกฎาคม สัปดาห์นี้เริ่มต้นไม่ดี

รูปแบบคลื่นในกราฟ 4 ชั่วโมงของเครื่องมือ EUR/USD ไม่ได้เปลี่ยนแปลงมาหลายเดือน ส่วนแนวโน้มขาขึ้นยังคงพัฒนาอย่างต่อเนื่อง และข่าวพื้นฐานยังคงสนับสนุนทุกสกุลเงินยกเว้นดอลลาร์สหรัฐ สงครามการค้าที่ Donald Trump เริ่มต้นขึ้นมีเป้าหมายเพื่อเพิ่มรายได้งบประมาณและขจัดการขาดดุลการค้า อย่างไรก็ตาม เป้าหมายเหล่านี้ยังไม่บรรลุผล ข้อตกลงทางการค้ากำลังถูกลงนามด้วยความยากลำบาก

Chin Zhao 22:19 2025-07-14 UTC+2

การคาดการณ์รายสัปดาห์โดยใช้การวิเคราะห์คลื่นแบบง่ายสำหรับ GBP/USD, AUD/USD, USD/CHF, EUR/JPY, AUD/JPY และดัชนีดอลลาร์สหรัฐ ณ วันที่ 14 กรกฎาคม

GBP/USD การวิเคราะห์: คลื่นขาขึ้นที่เริ่มต้นตั้งแต่เดือนมกราคมของปีนี้ได้เข้าสู่ช่วงการปรับฐาน ตั้งแต่ปลายเดือนที่แล้ว ราคายังคงดึงกลับจากขอบล่างของเขตกลับตัวที่แข็งแกร่งที่มีศักยภาพในตัวเองได้ บริเวณแนวรับคำนวณไว้ที่ขอบบนของเขตแนวรับใน time frame 4 ชั่วโมง การคาดการณ์: การเคลื่อนไหวแบบ Sideways คาดว่าจะเกิดขึ้นตลอดทั้งสัปดาห์ ช่วงต้นสัปดาห์อาจเห็นแนวโน้มลงไปยังแนวรับ

Isabel Clark 11:12 2025-07-14 UTC+2
หากไม่สะดวกคุยในตอนนี้
ระบุคำถามไว้ได้ใน แชท.
Widget callback
 

Dear visitor,

Your IP address shows that you are currently located in the USA. If you are a resident of the United States, you are prohibited from using the services of InstaFintech Group including online trading, online transfers, deposit/withdrawal of funds, etc.

If you think you are seeing this message by mistake and your location is not the US, kindly proceed to the website. Otherwise, you must leave the website in order to comply with government restrictions.

Why does your IP address show your location as the USA?

  • - you are using a VPN provided by a hosting company based in the United States;
  • - your IP does not have proper WHOIS records;
  • - an error occurred in the WHOIS geolocation database.

Please confirm whether you are a US resident or not by clicking the relevant button below. If you choose the wrong option, being a US resident, you will not be able to open an account with InstaForex anyway.

We are sorry for any inconvenience caused by this message.