empty
30.11.2022 06:12 PM
Trading Signal for Gold (XAU/USD) on November 30, 2022: buy if it rebounds off $1,750 (21 SMA - 8/8 Murray)

This image is no longer relevant

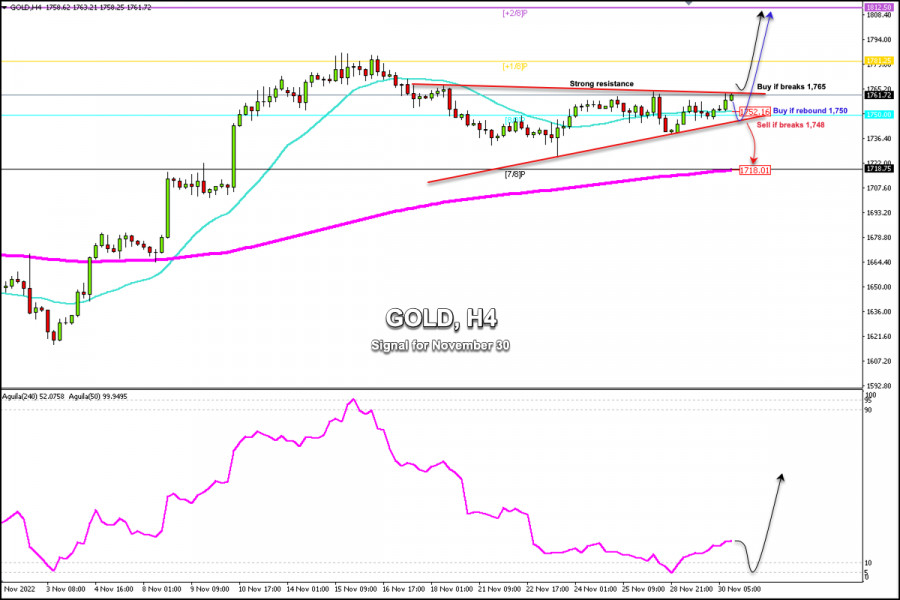
Early in the American session, gold is trading around 1,761.72. We can see on the 4-hour chart that it is testing strong resistance around 1,765. If XAU/USD fails to break it, there could be a technical correction towards the 21 SMA located at 1,752 in order to resume the bullish cycle.

The market outlook indicates a consensus for a 0.50% rise in the US interest rate, which is scheduled for the next meeting of the Federal Open Market Committee (FOMC) on December 13-14.

This data could keep gold under a consolidation zone between 1,789 and 1,718 for the next few days. Negative economic data for the US dollar could favor Gold and the metal could reach the area of 1,812. Positive data on the US economy and an increase in the yield of Treasury bonds could push gold towards the 200 EMA located at 1,718 and the price could even fall towards the area of 1,620 which represents November's low.

On the other hand, we can see that gold is showing signs of a possible upward movement on the 4-hour chart. So, we should wait for a confirmation above 1,765 to buy with targets at 1,781 and 1,812.

As long as gold trades around the area of $1,765, the metal has the potential to raise the price to the area of 1,775 -1,780. The next major hurdle is the 1,781 (+1/8 Murray) zone, the highest level since mid-August reached earlier this month. If settled above it, XAU/USD could try to reach the psychological level of 1,800 and even +2/8 Murray (1,812).

In case gold falls below the symmetrical triangle, we could expect a sharp break below 1,748. Then, gold could quickly fall towards the 7/8 Murray area which coincides with the 200 EMA which will be a sign to sell.

Summary
Urgency
Analytic
Dimitrios Zappas
Start trade
รับผลกำไรจากการเปลี่ยนแปลงอัตราสกุลเงินดิจิทัลกับ InstaForex.
ดาวน์โหลด MetaTrader 4 และเปิดการซื้อขายครั้งแรกของคุณ.
  • Grand Choice
    Contest by
    InstaForex
    InstaForex always strives to help you
    fulfill your biggest dreams.
    เข้าร่วมการแข่งขัน


บทความแนะนำ

สัญญาณการเทรดสำหรับ GOLD (XAU/USD) สำหรับวันที่ 4-7 สิงหาคม 2025: ขายเมื่อราคาต่ำกว่า $3,385 (เส้นค่าเฉลี่ยเคลื่อนที่แบบง่าย 21 - 6/8 Murray)

ในชั่วโมงข้างหน้า เราสามารถขายทองคำที่ต่ำกว่า 3,385 โดยมีเป้าหมายที่ระดับ 6/8 ของ Murray ที่ 3,359 ถ้าทองคำแตกต่ำกว่าบริเวณนี้ เราอาจจะเข้าสถานะ Short ต่อไปโดยมีเป้าหมายที่

Dimitrios Zappas 17:39 2025-08-04 UTC+2

สัญญาณการซื้อขายสำหรับ BITCOIN (BTC/USD) ระหว่างวันที่ 4-7 สิงหาคม 2025: ขายเมื่อราคาต่ำกว่า $115,625 หรือซื้อเมื่อราคาสูงกว่า $114,086 (200 EMA - 21 SMA)

Bitcoin กำลังซื้อขายอยู่ที่ประมาณ 115,404 ดอลลาร์สหรัฐ ซึ่งตรงกับแนวต้านของเส้น Murray 5/8 เราเชื่อว่าระดับนี้สามารถกดดันต่อ Bitcoin และเราคาดว่าอาจมีการปรับฐานทางเทคนิคไปที่แนว 21SMA ซึ่งอยู่ที่ 114,086 ดอลลาร์สหรัฐ หลังจากที่ร่วงลงอย่างรวดเร็วในช่วงสุดสัปดาห์

Dimitrios Zappas 17:22 2025-08-04 UTC+2

สัญญาณการซื้อขายคู่สกุลเงิน EUR/USD สำหรับวันที่ 4-7 สิงหาคม 2025: ขายต่ำกว่า 1.1602 (200 EMA - 7/8 Murray)

ในช่วงต้นของการซื้อขายในอเมริกา, ยูโรซื้อขายรอบๆ 1.1580 ต่ำกว่า 200 EMA และมีการดีดตัวทางเทคนิคที่แข็งแกร่ง หลังจากยูโรลดลงอย่างรวดเร็วเนื่องจากการประกาศ Non-Farm Payrolls ของสหรัฐฯ, ยูโรไปถึงจุดต่ำสุดของช่องแนวโน้มขาลงที่ประมาณ 1.1480. จากจุดนี้เราจะเห็นว่า EUR/USD

Dimitrios Zappas 17:20 2025-08-04 UTC+2

การวิเคราะห์เชิงเทคนิคสำหรับเดือนสิงหาคม 2025 - GBP/USD

การวิเคราะห์แนวโน้ม ในเดือนสิงหาคม ราคาอาจเริ่มเคลื่อนตัวขึ้นจากระดับ 1.3203 (ราคาปิดของแท่งเทียนรายเดือนกรกฎาคม) โดยมีเป้าหมายที่ระดับ 1.3539 ซึ่งเป็นระดับการทดสอบที่ 14.6% (เส้นประสีแดง) เมื่อทดสอบระดับนี้แล้ว ราคาอาจมีการดึงกลับลงมายังระดับทดสอบที่ 23.6% ที่ 1.3386

Stefan Doll 12:03 2025-08-04 UTC+2

การวิเคราะห์ทางเทคนิคสำหรับเดือนสิงหาคม 2025 – EUR/USD

การวิเคราะห์แนวโน้ม ในเดือนสิงหาคม ราคาอาจเริ่มเคลื่อนที่ขึ้นจากระดับ 1.1414 (การปิดของเทียนรายเดือนในเดือนกรกฎาคม) ไปยังเป้าหมายที่ 1.1710 – แนวต้านในอดีต (เส้นประสีน้ำเงิน) จากระดับนี้ อาจมีการเคลื่อนที่ลงแก้ไขเป้าหมายที่ 1.1588 – ระดับการย้อนกลับ

Stefan Doll 12:00 2025-08-04 UTC+2

การคาดการณ์สำหรับ EUR/USD ในวันที่ 4 สิงหาคม 2025

ในวันศุกร์ คู่เงิน EUR/USD ได้กลับตัวใกล้ระดับการปรับตัว 161.8% ที่ 1.1416 ซึ่งเป็นการหันไปทางยูโรและพุ่งขึ้นอย่างรวดเร็ว การทรงตัวเหนือระดับ Fibonacci 100.0% ที่ 1.1558 เปิดโอกาสให้กับการเติบโตต่อเนื่อง แต่ในขณะนี้

Samir Klishi 11:49 2025-08-04 UTC+2

GBP/USD - 4 สิงหาคม: เงินปอนด์จะได้รับประโยชน์จากการถอยของดอลลาร์หรือไม่?

ในกราฟแบบรายชั่วโมง คู่สกุลเงิน GBP/USD ได้กลับมาสนับสนุนเงินปอนด์อังกฤษเมื่อวันศุกร์ที่ผ่านมา และมีการเคลื่อนไหวเหนือระดับ Fibonacci 127.2% ที่ 1.3258 ดังนั้นในวันจันทร์ การเคลื่อนไหวในทิศทางขาขึ้นอาจดำเนินต่อไปสู่โซนแนวต้านที่ 1.3357–1.3371 การปิดต่ำกว่า 1.3258 จะสนับสนุนค่าเงินดอลลาร์สหรัฐและอาจนำไปสู่การลดลงสู่โซนแนวรับที่

Samir Klishi 11:46 2025-08-04 UTC+2

GBP/USD: การวิเคราะห์ทางเทคนิคสำหรับสัปดาห์ที่ 4-9 สิงหาคม

การวิเคราะห์แนวโน้ม ในสัปดาห์นี้ ราคาอาจเริ่มเคลื่อนไหวขึ้นจากระดับ 1.3278 (ปิดของแท่งเทียนรายสัปดาห์ล่าสุด) ไปยังเป้าหมายที่ 1.3389 - ระดับการปรับตัวกลับตัว 23.6% (เส้นประสีแดง) เมื่อทดสอบระดับนี้แล้ว ราคาอาจเคลื่อนไหวขึ้นต่อไปยังเป้าหมายที่ 1.3540

Stefan Doll 11:38 2025-08-04 UTC+2

EUR/USD. การวิเคราะห์ทางเทคนิคสำหรับสัปดาห์วันที่ 4-9 สิงหาคม

ในสัปดาห์นี้ จากระดับ 1.1586 (ราคาเปิดปิดของแท่งเทียนรายสัปดาห์ล่าสุด) ตลาดอาจเริ่มเคลื่อนที่ขึ้น โดยมีเป้าหมายที่ระดับ 1.1829 ซึ่งเป็น fractal ด้านบน (แท่งเทียนรายสัปดาห์ตั้งแต่วันที่ 29 มิถุนายน 2025) เมื่อถึงระดับนี้แล้ว

Stefan Doll 10:38 2025-08-04 UTC+2

GBP/USD. การวิเคราะห์ตัวชี้วัดและรีวิวรายวันประจำวันที่ 4 สิงหาคม 2025

ในวันจันทร์ จากระดับ 1.3278 (ราคาปิดในกราฟแท่งเทียนรายวันของวันศุกร์) ตลาดอาจเริ่มทำการแก้ไขด้วยการเคลื่อนลง โดยมีเป้าหมายที่ระดับ 1.3243 ซึ่งเป็นระดับการย้อนกลับ 14.6% (เส้นประสีแดง) หลังจากทดสอบระดับนี้แล้ว ราคามีโอกาสกลับมาเคลื่อนที่ขึ้นไปยังระดับ 1.3337 ซึ่งเป็นระดับการย้อนกลับ 38.2%

Stefan Doll 10:28 2025-08-04 UTC+2
หากไม่สะดวกคุยในตอนนี้
ระบุคำถามไว้ได้ใน แชท.
Widget callback
 

Dear visitor,

Your IP address shows that you are currently located in the USA. If you are a resident of the United States, you are prohibited from using the services of InstaFintech Group including online trading, online transfers, deposit/withdrawal of funds, etc.

If you think you are seeing this message by mistake and your location is not the US, kindly proceed to the website. Otherwise, you must leave the website in order to comply with government restrictions.

Why does your IP address show your location as the USA?

  • - you are using a VPN provided by a hosting company based in the United States;
  • - your IP does not have proper WHOIS records;
  • - an error occurred in the WHOIS geolocation database.

Please confirm whether you are a US resident or not by clicking the relevant button below. If you choose the wrong option, being a US resident, you will not be able to open an account with InstaForex anyway.

We are sorry for any inconvenience caused by this message.