empty
08.05.2022 04:19 PM
How to trade EUR/USD on May 9? Simple tips for beginners.

Analysis of previous deals:

30M chart of the EUR/USD pair

This image is no longer relevant

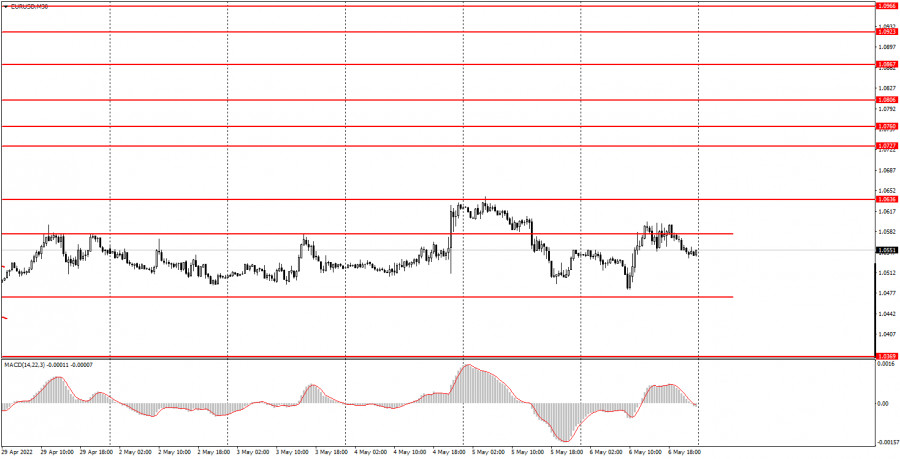
The EUR/USD currency pair, by and large, continued to trade in the horizontal channel on Friday, which is shown in the chart above. The pair left this horizontal channel on Wednesday and Thursday, so it is somewhat formal at this time. However, one should take into account the fact that this "exit" was due to the Federal Reserve meeting and its development. It is quite possible that if there had been no meeting, the pair would have continued to trade within the channel. Thus, we propose to consider that the pair has been in a flat for six trading days, which is located near 5-year lows. That is, the pair is trading sideways at the very "bottom" of the downward trend, which is still preserved, since for all this time we have not seen a tangible upward correction. Therefore, now the question is as follows: when will the euro resume to fall? We have already said that the only possible factor for the pair's growth is the absence of a strong correction: the price cannot constantly move in only one direction. But there are many more downside factors. We also note that on Friday the market actually ignored macroeconomic statistics from America. There was at least one important report - NonFarm Payrolls - the number of new jobs created outside the agricultural sector. Their number was 428,000, which in itself is a high value, and besides this, it was above the forecast. However, the dollar failed to show new growth due to this report.

5M chart of the EUR/USD pair

This image is no longer relevant

The technical picture on the 5-minute timeframe looks very good. Only two trading signals were formed during the day, both of which are not false, which is just fine for a flat. The pair has been in the horizontal channel all day between the levels of 1.0490 and 1.0593. That is, volatility remained very high, despite the flat. First, the pair rebounded from the level of 1.0490. It rebounded very accurately, allowing novice traders to open long positions. A few hours later, the price hit the 1.0578-1.0593 area, spent five or six hours around it, and eventually bounced from it, forming a sell signal. This signal should be used to leave long positions and open shorts. Profit on the first deal was about 60 points. It was not possible to make money on the short position, because until the very evening the pair could not really leave the area of 1.0578-1.0593.

How to trade on Monday:

The trend remains downward on the 30-minute timeframe, despite the formed flat. We believe that the pair can resume to fall at any moment, but we draw your attention to the fact that the euro has been falling for quite a long time and a correction will begin sooner or later. On the 5-minute TF tomorrow it is recommended to trade at the levels of 1.0369, 1.0471-1.0490, 1.0578-1.0593, 1.0636, 1.0697. When passing 15 points in the right direction, you should set Stop Loss to breakeven. There will be no important reports and events in the European Union on Monday. In the US, only a speech by a member of the Fed's Monetary Committee, Rafael Bostic, will take place. However, volatility has been very high in recent weeks. Most likely, it will decrease, but hardly to "zero" values.

Basic rules of the trading system:

1) The signal strength is calculated by the time it took to form the signal (bounce or overcome the level). The less time it took, the stronger the signal.

2) If two or more deals were opened near a certain level based on false signals (which did not trigger Take Profit or the nearest target level), then all subsequent signals from this level should be ignored.

3) In a flat, any pair can form a lot of false signals or not form them at all. But in any case, at the first signs of a flat, it is better to stop trading.

4) Trade deals are opened in the time period between the beginning of the European session and until the middle of the American one, when all deals must be closed manually.

5) On the 30-minute TF, using signals from the MACD indicator, you can trade only if there is good volatility and a trend, which is confirmed by a trend line or a trend channel.

6) If two levels are located too close to each other (from 5 to 15 points), then they should be considered as an area of support or resistance.

On the chart:

Support and Resistance Levels are the Levels that serve as targets when buying or selling the pair. You can place Take Profit near these levels.

Red lines are the channels or trend lines that display the current trend and show in which direction it is better to trade now.

The MACD indicator (14,22,3) consists of a histogram and a signal line. When they cross, this is a signal to enter the market. It is recommended to use this indicator in combination with trend lines (channels and trend lines).

Important speeches and reports (always contained in the news calendar) can greatly influence the movement of a currency pair. Therefore, during their exit, it is recommended to trade as carefully as possible or exit the market in order to avoid a sharp price reversal against the previous movement.

Beginners on Forex should remember that not every single trade has to be profitable. The development of a clear strategy and money management are the key to success in trading over a long period of time.

Paolo Greco,
ผู้เชี่ยวชาญด้านการวิเคราะห์ของ InstaForex
© 2007-2025
เลือกช่วงเวลา
5
นาที
15
นาที
30
นาที
1
ชั่วโมง
4
ชั่วโมง
1
วัน
1
สัปดาห์
รับผลกำไรจากการเปลี่ยนแปลงอัตราสกุลเงินดิจิทัลกับ InstaForex.
ดาวน์โหลด MetaTrader 4 และเปิดการซื้อขายครั้งแรกของคุณ.
EUR/USD: แผนการเทรดสำหรับช่วงสหรัฐอเมริกาในวันที่ 4 กรกฎาคม (ทบทวนการซื้อขายในช่วงเช้า) ในการพยากรณ์ตอนเช้าของฉัน ฉันเน้นระดับ 1.1787 ว่าเป็นจุดสำคัญในการตัดสินใจซื้อขาย ลองมาดูกราฟ 5 นาทีเพื่อวิเคราะห์สิ่งที่เกิดขึ้น การขึ้นและการทะลุเทียมใกล้ 1.1787 นำไปสู่การเข้าสู่สถานะขาย แต่การลดลงอย่างมีนัยสำคัญในคู่สกุลเงินไม่ได้เกิดขึ้น มุมมองทางเทคนิคไม่ได้เปลี่ยนแปลงสำหรับช่วงครึ่งหลังของวัน ข้อมูลอ่อนของคำสั่งซื้อภาคอุตสาหกรรมของเยอรมันและยอดขายปลีกของอิตาลีได้จำกัดศักยภาพการขึ้นของคู่เงินนี้ในช่วงครึ่งแรกของวัน ในการซื้อขายช่วงสหรัฐฯ ความผันผวนอาจลดลงเพิ่มเติมเนื่องจากวันหยุด
USD/JPY: การวิเคราะห์และพยากรณ์ คู่เงิน USD/JPY กำลังถืออยู่เหนือระดับสำคัญที่ 144.00 ท่ามกลางความอ่อนแออย่างต่อเนื่องของดอลลาร์สหรัฐฯ ข้อมูลการใช้จ่ายของครัวเรือนที่แข็งแกร่งซึ่งถูกเผยแพร่ในญี่ปุ่นวันนี้ได้เพิ่มความคาดหวังว่าจะมีการขึ้นอัตราดอกเบี้ยจากธนาคารกลางญี่ปุ่น ซึ่งส่งผลให้ค่าเงินเยนแข็งตัวขึ้น นอกจากนี้ ความไม่แน่นอนเกี่ยวกับจุดยืนนโยบายของประธานาธิบดีโดนัลด์ ทรัมป์ ของสหรัฐฯ กำลังย้ำสถานะของเยนในฐานะสินทรัพย์ปลอดภัย อย่างไรก็ตาม ความกังวลของนักลงทุนยังคงสูงขึ้นเนื่องจากความตึงเครียดทางการค้าที่เกิดจากคำขู่ของทรัมป์ที่จะเพิ่มภาษีศุลกากรสำหรับสินค้าญี่ปุ่น โดยอ้างว่าญี่ปุ่นไม่เต็มใจที่จะซื้อข้าวสหรัฐฯ
  • Grand Choice
    Contest by
    InstaForex
    InstaForex always strives to help you
    fulfill your biggest dreams.
    เข้าร่วมการแข่งขัน


บทความแนะนำ

EUR/USD: แผนการเทรดสำหรับช่วงสหรัฐอเมริกาในวันที่ 4 กรกฎาคม (ทบทวนการซื้อขายในช่วงเช้า)

ในการพยากรณ์ตอนเช้าของฉัน ฉันเน้นระดับ 1.1787 ว่าเป็นจุดสำคัญในการตัดสินใจซื้อขาย ลองมาดูกราฟ 5 นาทีเพื่อวิเคราะห์สิ่งที่เกิดขึ้น การขึ้นและการทะลุเทียมใกล้ 1.1787 นำไปสู่การเข้าสู่สถานะขาย แต่การลดลงอย่างมีนัยสำคัญในคู่สกุลเงินไม่ได้เกิดขึ้น มุมมองทางเทคนิคไม่ได้เปลี่ยนแปลงสำหรับช่วงครึ่งหลังของวัน ข้อมูลอ่อนของคำสั่งซื้อภาคอุตสาหกรรมของเยอรมันและยอดขายปลีกของอิตาลีได้จำกัดศักยภาพการขึ้นของคู่เงินนี้ในช่วงครึ่งแรกของวัน ในการซื้อขายช่วงสหรัฐฯ ความผันผวนอาจลดลงเพิ่มเติมเนื่องจากวันหยุด

Miroslaw Bawulski 18:16 2025-07-04 UTC+2

วิธีการเทรดคู่สกุลเงิน GBP/USD ในวันที่ 4 กรกฎาคม? เคล็ดลับง่ายๆ และการวิเคราะห์การเทรดสำหรับผู้เริ่มต้น

ในวันพฤหัสบดี คู่สกุลเงิน GBP/USD ได้ร่วงลงอีกครั้ง แต่ครั้งนี้การร่วงลงของค่าเงินอังกฤษกินเวลาเพียงแค่ห้านาที เหตุผลที่สกุลเงินดอลลาร์สหรัฐแข็งค่าขึ้นในวันพฤหัสบดีนั้นมีความสำคัญมากกว่าวันพุธ แต่ถึงกระนั้นเมื่อสิ้นสุดวันพฤหัสบดี ดอลลาร์ก็ไม่ได้แข็งค่าขึ้นแม้แต่จุดเดียวเลย ต้องย้อนไปในวันพุธ นักวิเคราะห์จำนวนมากคาดการณ์ว่าค่าเงินอังกฤษได้ร่วงลงไปถึง 200 จุดเพราะว่ารัฐมนตรีคลัง UK Rachel Reeves

Paolo Greco 07:16 2025-07-04 UTC+2

วิธีการเทรดคู่สกุลเงิน EUR/USD ในวันที่ 4 กรกฎาคม? เคล็ดลับง่ายๆ และการวิเคราะห์การเทรดสำหรับผู้เริ่มต้น

คู่สกุลเงิน EUR/USD ได้มีการซื้อขายตลอดวันพฤหัสบดี ทั้งก่อนและหลังการประกาศข้อมูลการจ้างงานนอกภาคเกษตรและอัตราการว่างงานของสหรัฐฯ การเคลื่อนไหวของราคาอยู่ในรูปแบบแนวราบอย่างสมบูรณ์ทั้งก่อนและหลังการเผยแพร่ข้อมูลเศรษฐกิจมหภาคของสหรัฐฯ ทันทีที่รายงานถูกเผยแพร่ออกมา ราคาก็ลดลงอย่างรวดเร็ว แต่ภายในชั่วโมงถัดมา ราคาก็กลับฟื้นตัวขึ้นเกือบเต็มที่ อัตราการว่างงานของสหรัฐฯ ลดลงมาอยู่ที่ 4.1% ซึ่งขัดกับการคาดการณ์ และจำนวนการจ้างงานนอกภาคเกษตรเพิ่มขึ้น 147,000

Paolo Greco 06:34 2025-07-04 UTC+2

คำแนะนำและการวิเคราะห์สำหรับการซื้อขาย GBP/USD ในวันที่ 4 กรกฎาคม: ดอลลาร์เพิ่มขึ้น — แล้วลดลงอีกครั้ง

คู่สกุลเงิน GBP/USD ในวันพฤหัสบดีโชว์ความเคลื่อนไหวที่เกือบจะเหมือนกันกับคู่สกุลเงิน EUR/USD ซึ่งไม่น่าแปลกใจเท่าไหร่ เพราะในช่วงห้าเดือนที่ผ่านมาไม่ใช่ยูโรหรือปอนด์ที่เพิ่มขึ้น แต่เป็นดอลลาร์ที่ตกลง ดังนั้น ใน 95% ของกรณี ดอลลาร์มักจะร่วงหรือไม่ก็อยู่เท่านั้น ในสัปดาห์นี้ ปอนด์อังกฤษได้รับแรงกดดันเพียงครั้งเดียวจากปัจจัยที่ไม่เกี่ยวข้องกับข่าวของสหรัฐฯ อย่างไรก็ตาม

Paolo Greco 03:56 2025-07-04 UTC+2

คำแนะนำและการวิเคราะห์การซื้อขายสำหรับ EUR/USD ในวันที่ 4 กรกฎาคม: วันประกาศอิสรภาพของสหรัฐอเมริกา

คู่สกุลเงิน EUR/USD มีการซื้อขายอย่างมีความเคลื่อนไหวในวันพฤหัสบดี ส่วนใหญ่ของวันเราสังเกตเห็นความเคลื่อนไหวด้านข้างที่มีความผันผวนต่ำ และทันทีที่มีการเปิดเผยข้อมูลตลาดแรงงานและอัตราการว่างงานของสหรัฐฯ ราคาก็ลดลง และการลดลงนี้ไม่ใช่เรื่องที่ไร้เหตุผล เนื่องจากรายงานที่สำคัญที่สุดสองฉบับของสัปดาห์ออกมาดีกว่าที่คาดการณ์ไว้ อัตราการว่างงานลดลงในเดือนมิถุนายน ซึ่งขัดกับตรรกะและความรู้สึกทั่วไป และตัวเลขการจ้างงานนอกภาคการเกษตร (NonFarm Payrolls) ก็สูงกว่าที่คาดหวังไว้อย่างมาก อย่างไรก็ตาม

Paolo Greco 03:56 2025-07-04 UTC+2

GBP/USD: แผนการซื้อขายสำหรับตลาดสหรัฐฯ วันที่ 3 กรกฎาคม (รีวิวการซื้อขายช่วงเช้า)

ในบทวิเคราะห์ตอนเช้าของฉัน ฉันได้เน้นไปที่ระดับ 1.3659 และวางแผนการตัดสินใจซื้อขายโดยอิงตามระดับนี้ ลองดูกราฟ 5 นาทีและทบทวนเหตุการณ์ที่เกิดขึ้น ราคาปรับตัวสูงขึ้นและเกิดการทะลุปลอมรอบ 1.3659 ซึ่งเป็นจุดเข้าที่ดีสำหรับการขายปอนด์แต่หลังจากลดลงไป 15 จุด ความต้องการก็กลับมาอีกครั้ง มุมมองทางเทคนิคถูกปรับปรุงใหม่สำหรับครึ่งหลังของวัน การเปิดสถานะ

Miroslaw Bawulski 15:34 2025-07-03 UTC+2

EUR/USD: แผนการเทรดสำหรับช่วงการซื้อขายในสหรัฐอเมริกาวันที่ 3 กรกฎาคม (ทบทวนการซื้อขายช่วงเช้า)

ในคำพยากรณ์ช่วงเช้าของฉัน ฉันได้เน้นถึงระดับ 1.1784 ว่าเป็นจุดอ้างอิงสำคัญสำหรับการเข้าสู่ตลาด มาดูกราฟ 5 นาทีและวิเคราะห์สิ่งที่เกิดขึ้นกัน ราคาปรับตัวลดลงมาทางระดับ 1.1784 แต่ไม่เคยถึงระดับนั้นจริง ๆ — ดังนั้นจึงไม่มีการซื้อขายเกิดขึ้น มุมมองทางเทคนิคสำหรับครึ่งหลังของวันยังคงไม่เปลี่ยนแปลง การเปิดสถานะซื้อ

Miroslaw Bawulski 15:29 2025-07-03 UTC+2

วิธีการซื้อขายคู่สกุลเงิน GBP/USD ในวันที่ 3 กรกฎาคม? เคล็ดลับง่ายๆ และการวิเคราะห์การซื้อขายสำหรับผู้เริ่มต้น

ในวันพุธ คู่สกุลเงิน GBP/USD ร่วงหล่นเหมือนก้อนหินที่ถูกปล่อยจากยอดตึกระฟ้า ทำให้นักวิเคราะห์สกุลเงินต้องค้นหาสาเหตุของการตกลงอย่างฉับพลันนี้ทันที อย่างไรก็ตาม เรามีมุมมองที่ต่างไปต่อการเคลื่อนไหวของตลาดในลักษณะนี้: ไม่ใช่ทุกครั้งจะมีเหตุผลที่ชัดเจน ปอนด์อังกฤษได้ขึ้นมาเป็นเวลานานและได้มีสถานะ Overbought และมีผู้ทำตลาดในตลาดเพียงพอที่ล่าหาสภาพคล่องจากนักเทรดรายย่อย ดังนั้นจึงเป็นไปได้ว่าที่เราเห็นเป็นการตกที่อาจนำไปสู่การฟื้นตัวใหม่ของสกุลเงินอังกฤษได้ เราไม่เห็นเหตุผลที่จะทำให้ปอนด์ดิ่งลงอย่างเฉียบพลัน "อย่างไม่คาดคิด" วันนี้

Paolo Greco 06:53 2025-07-03 UTC+2

วิธีการซื้อขายคู่สกุลเงิน EUR/USD ในวันที่ 3 กรกฎาคม? เคล็ดลับง่ายๆ และการวิเคราะห์การซื้อขายสำหรับมือใหม่

ในวันพุธ คู่สกุลเงิน EUR/USD พยายามเริ่มรอบใหม่ของการแก้ไขขาลง และผลของความพยายามนี้สามารถเห็นได้ในทุกกรอบเวลาที่ใช้ ดังนั้นการแข็งค่าของดอลลาร์สหรัฐ แม้จะเพิ่มขึ้น แต่ก็นับว่าเป็นการแข็งค่าที่อ่อนแอและเกิดขึ้นในช่วงเวลาสั้น ๆ สิ่งที่น่าสังเกตคือ การเคลื่อนไหวของ EUR/USD เมื่อวานนี้สามารถผูกโยงกับปัจจัยพื้นฐานทางเศรษฐกิจมหภาคได้อย่างง่ายดาย ซึ่งอย่างไรก็ตาม ภูมิหลังทางเศรษฐกิจมหภาคนี้ยังคงอ่อนแอ

Paolo Greco 06:33 2025-07-03 UTC+2

คำแนะนำและการวิเคราะห์การซื้อขายสำหรับ GBP/USD ในวันที่ 3 กรกฎาคม: การจัดการเพื่อการรณรงค์ครั้งใหม่?

ในวันพุธที่ผ่านมา คู่สกุลเงิน GBP/USD ตกลงอย่างฉับพลันโดยไม่มีเหตุผลที่ชัดเจน ไม่มีข่าวสำคัญใด ๆ ในสหราชอาณาจักรหรือสหรัฐที่อาจทำให้ค่าเงินปอนด์สเตอริงค์ลดลงเกือบ 200 จุด แต่จากมุมมองทางเทคนิคแล้ว ราคาปรับฐานได้ดีและอยู่บนเส้น Senkou Span B หลังจากที่มีการปรับตัวขึ้นอย่างแข็งแกร่ง

Paolo Greco 03:45 2025-07-03 UTC+2
หากไม่สะดวกคุยในตอนนี้
ระบุคำถามไว้ได้ใน แชท.
Widget callback
 

Dear visitor,

Your IP address shows that you are currently located in the USA. If you are a resident of the United States, you are prohibited from using the services of InstaFintech Group including online trading, online transfers, deposit/withdrawal of funds, etc.

If you think you are seeing this message by mistake and your location is not the US, kindly proceed to the website. Otherwise, you must leave the website in order to comply with government restrictions.

Why does your IP address show your location as the USA?

  • - you are using a VPN provided by a hosting company based in the United States;
  • - your IP does not have proper WHOIS records;
  • - an error occurred in the WHOIS geolocation database.

Please confirm whether you are a US resident or not by clicking the relevant button below. If you choose the wrong option, being a US resident, you will not be able to open an account with InstaForex anyway.

We are sorry for any inconvenience caused by this message.