empty
08.05.2022 03:47 PM
GBP/USD analysis on May 8. Difficult times for the pound are coming to an end.

This image is no longer relevant

For the pound/dollar instrument, the wave markup continues to look very convincing and does not require adjustments. The downward section of the trend continues its construction within the framework of the wave e-E, and its internal wave marking looks quite complicated. Nevertheless, I have identified five waves inside this wave and, if my markup is correct, then wave 5, the last internal wave, is being built at this time. Thus, we get almost identical wave markings for the British and the European, each of which indicates the possible imminent completion of the downward trend section. Or it will have to take a much more complex and extended form than a weak news background or a complex geopolitical one can contribute to. The meetings of the Bank of England and the Fed resulted in a new decline in demand for the British dollar, although their results cannot be considered "positive only for the dollar." If the current wave marking does not become more complicated, then the decline in the British dollar may end within the next week.

The pound experienced shock instead of joy and euphoria.

The exchange rate of the pound/dollar instrument decreased by 10 basis points on May 6, but what difference does it make how much it lost on Friday if it ended Thursday with a result of -280 points? The pound has experienced another difficult week for itself, although the current wave marking suggests the imminent completion of his fall. I would like to note that the market practically ignored the results of the Bank of England meeting. To be more precise, the market reaction was not quite appropriate. After all, the British regulator raised the interest rate for the fourth time in a row, but the demand for the pound at the same time fell very much. From my point of view, such a reaction cannot be considered correct and indirectly indicates that the market is now trying to complete the downward trend section without violations in the wave marking and without complicating it. If this is true, then the construction will be completed in the near future, after which the pound may already rise quite a lot, as if playing back all the news that was ignored during its decline.

Separately, I want to note that geopolitics is gradually weakening its influence on the pound and the euro. There have been no important events at the front in recent weeks, nevertheless, the Ukrainian-Russian conflict persists and is likely to be very protracted. Kyiv and Moscow show no signs of wanting to end the conflict. I mean, there are no real signs, since both sides would like to stop everything. This conflict is not beneficial for both of them and destroys their economy. Both sides are suffering huge financial losses. In addition, Ukraine is losing infrastructure, which will have to be rebuilt for many years, and the Russian Federation has already been isolated from most of the world and it will also take years to restore economic ties. However, Kyiv's position is as follows: the resumption of peace talks will be possible only if the Russian Federation withdraws its troops from the borders of Ukraine. Moscow's position is the opposite. Compromise is not possible at this time.

General conclusions.

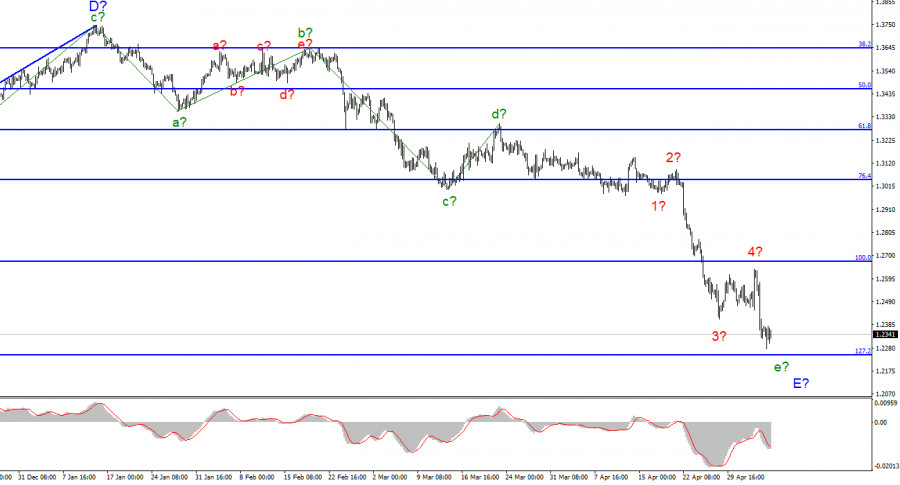
The wave pattern of the pound/dollar instrument still assumes the construction of wave E. I continue to advise selling the instrument with targets located around the 1.2246 mark, which corresponds to 127.2% Fibonacci, according to the MACD signals "down". I don't see a pound below this mark yet. From my point of view, the construction of a downward section of the trend is nearing its completion and the mark of 1.2246 looks very good for the trend to end right around it. However, a successful attempt to break through this mark - and it will be possible to stay in sales.

This image is no longer relevant

At the higher scale, wave D looks complete, but the entire downward section of the trend does not. Therefore, I still expect a continuation of the decline of the instrument with targets located around the 22nd figure. Wave E takes on a five-wave appearance but still doesn't look fully equipped. However, it already takes a little time to complete the complete set.

Chin Zhao,
ผู้เชี่ยวชาญด้านการวิเคราะห์ของ InstaForex
© 2007-2025
เลือกช่วงเวลา
5
นาที
15
นาที
30
นาที
1
ชั่วโมง
4
ชั่วโมง
1
วัน
1
สัปดาห์
รับผลกำไรจากการเปลี่ยนแปลงอัตราสกุลเงินดิจิทัลกับ InstaForex.
ดาวน์โหลด MetaTrader 4 และเปิดการซื้อขายครั้งแรกของคุณ.
ECB อาจปรับลดอัตราดอกเบี้ยสองครั้ง ค่าเงินยูโรกำลังแสดงการปรับตัวขึ้นอย่างรวดเร็วเมื่อเทียบกับดอลลาร์สหรัฐ คู่สกุลเงิน EUR/USD ได้แตะระดับสูงสุดในรอบสามปีแล้วและยังไม่มีสัญญาณว่าจะชะลอตัวลง ขณะเดียวกัน จากการสำรวจความคิดเห็นของนักเศรษฐศาสตร์ มีความเป็นไปได้ที่เจ้าหน้าที่ของธนาคารกลางยุโรปจะปรับลดต้นทุนการกู้ยืมลงอีกหลายครั้ง ถึงแม้จะมีการคาดการณ์ในท้ายที่สุดว่าพวกเขาจะปฏิบัติตามแนวทางของธนาคารกลางสหรัฐ ผู้ตอบแบบสอบถามคาดว่าจะมีการลดอัตราดอกเบี้ยครั้งละหนึ่งในสี่ในเดือนเมษายนและมิถุนายน ซึ่งหลังจากนั้นอัตราดอกเบี้ยเงินฝากคาดว่าจะคงที่ที่ 2% นักเศรษฐศาสตร์เตือนว่านโยบายการค้าของสหรัฐฯ มีความเสี่ยงสำคัญ ที่อาจกระทบการเติบโตทางเศรษฐกิจของยูโรโซน มาตรการปกป้องที่เพิ่มขึ้น
  • Grand Choice
    Contest by
    InstaForex
    InstaForex always strives to help you
    fulfill your biggest dreams.
    เข้าร่วมการแข่งขัน


บทความแนะนำ

การวิเคราะห์ EUR/USD – 10 เมษายน

รูปแบบคลื่นบนกราฟ 4 ชั่วโมงของคู่สกุลเงิน EUR/USD ได้เปลี่ยนไปมีโครงสร้างขาขึ้น ข้าพเจ้าเชื่อว่าไม่มีข้อสงสัยว่าการเปลี่ยนแปลงนี้เกิดขึ้นเพียงเพราะนโยบายการค้าของสหรัฐฯ ที่เปลี่ยนแปลงใหม่ จนถึงวันที่ 28 กุมภาพันธ์ เมื่อการลดลงอย่างรวดเร็วของดอลลาร์สหรัฐเริ่มต้นขึ้น โครงสร้างคลื่นทั้งหมดได้ก่อตัวเป็นแนวโน้มขาลงที่น่าเชื่อ สร้างคลื่นปรับฐาน 2 อย่างไรก็ตาม

Chin Zhao 20:24 2025-04-10 UTC+2

การวิเคราะห์ GBP/USD – 10 เมษายน

โครงสร้างคลื่นสำหรับคู่ GBP/USD ได้เปลี่ยนไปเป็นโครงสร้างแนวโน้มขาขึ้นแบบเร้าใจ — "ขอบคุณ" โดนัลด์ ทรัมป์ รูปแบบคลื่นคล้ายกันมากกับคู่ EUR/USD ก่อนวันที่ 28 กุมภาพันธ์ เราสังเกตเห็นการพัฒนาโครงสร้างการแก้ไขที่น่าเชื่อซึ่งไม่มีสัญญาณเตือนใดๆ อย่างไรก็ตาม ความต้องการสำหรับดอลลาร์สหรัฐเริ่มลดลงอย่างรวดเร็วหลังจากนั้น

Chin Zhao 20:21 2025-04-10 UTC+2

การวิเคราะห์ EUR/USD - 8 เมษายน

รูปแบบคลื่นบนกราฟ 4 ชั่วโมงสำหรับ EUR/USD ได้เปลี่ยนเป็นรูปแบบขาขึ้นแล้ว ฉันเชื่อว่าไม่มีข้อสงสัยว่าการเปลี่ยนแปลงนี้สืบเนื่องจากนโยบายการค้าที่ใหม่ของสหรัฐฯ จนถึงวันที่ 28 กุมภาพันธ์ เมื่อค่าเงินดอลลาร์สหรัฐฯเริ่มตกลงอย่างรวดเร็ว ทั้งหมดของโครงสร้างคลื่นดูเหมือนว่าเป็นช่วงแนวโน้มขาลงที่น่าเชื่อถือ โดยที่กำลังเกิดคลื่นปรับฐานที่ 2 ทว่า คำแถลงการณ์รายสัปดาห์จาก

Chin Zhao 19:51 2025-04-08 UTC+2

การวิเคราะห์ GBP/USD - วันที่ 8 เมษายน

รูปแบบคลื่นสำหรับ GBP/USD ก็ได้เปลี่ยนเป็นโครงสร้างคลื่นขาขึ้นเชิงโปร่งใส "ขอบคุณ" Donald Trump รูปแบบคลื่นเกือบจะเหมือนกับ EUR/USD จนถึงวันที่ 28 กุมภาพันธ์ เราสังเกตพัฒนาการของโครงสร้างการปรับฐานที่น่าเชื่อถือซึ่งไม่มีปัญหา อย่างไรก็ตาม ความต้องการของดอลลาร์สหรัฐฯ ก็เริ่มลดลงอย่างรวดเร็ว

Chin Zhao 19:48 2025-04-08 UTC+2

การวิเคราะห์ EUR/USD – วันที่ 7 เมษายน

โครงสร้างคลื่นบนกราฟ 4 ชั่วโมงของคู่สกุลเงิน EUR/USD ได้เปลี่ยนไปเป็นขาขึ้น ผมเชื่อว่าไม่มีใครสงสัยว่าการเปลี่ยนแปลงนี้เกิดขึ้นจากนโยบายการค้าของสหรัฐอเมริกาใหม่อย่างชัดเจน จนถึงวันที่ 28 กุมภาพันธ์ เมื่อเงินดอลลาร์สหรัฐเริ่มลดลงอย่างรวดเร็ว โครงสร้างคลื่นทั้งหมดดูเหมือนเป็นแนวโน้มขาลงที่น่าเชื่อถือ — การสร้างคลื่นแก้ไขที่ 2 อย่างไรก็ตาม

Chin Zhao 19:25 2025-04-07 UTC+2

การวิเคราะห์ GBP/USD – วันที่ 7 เมษายน

โครงสร้างคลื่นของ GBP/USD ได้เปลี่ยนไปสู่ความหมายขึ้นที่คมชัด ในทางการกระตุ้นซึ่งเป็นผลมาจาก "การช่วยเหลือ" ของดอนัลด์ ทรัมป์ รูปแบบคลื่นนั้นเหมือนกับ EUR/USD จนถึงวันที่ 28 กุมภาพันธ์ เราสังเกตการเริ่มปรับปรุงความถูกต้อง ที่เป็นน่าเชื่อถือ แต่หลังจากนั้นความต้องการสกุลเงินดอลลาร์สหรัฐฯ

Chin Zhao 19:22 2025-04-07 UTC+2

การพยากรณ์รายสัปดาห์ตามการวิเคราะห์คลื่นที่เรียบง่ายสำหรับ GBP/USD, AUD/USD, USD/CHF, EUR/JPY, EUR/GBP, และดัชนีดอลลาร์สหรัฐ – 7 เมษายน

GBP/USD การวิเคราะห์: ตั้งแต่เดือนมกราคมของปีนี้ คลื่นขาขึ้นได้กำหนดทิศทางราคาในคู่สกุลเงินหลักของปอนด์อังกฤษ หลังจากไปถึงขอบล่างของโซนการกลับตัวที่มีอิทธิพล ราคาก็เริ่มลดลงอย่างรวดเร็ว ซึ่งเป็นการเริ่มต้นของการปรับฐานที่เต็มรูปแบบ การคาดการณ์: การเคลื่อนไหวในด้านข้างคาดว่าจะเกิดขึ้นในครึ่งแรกของสัปดาห์บริเวณแนวต้าน เมื่อใกล้ถึงวันหยุดสุดสัปดาห์ ราคามีโอกาสที่จะเริ่มลดลงอีกครั้ง ซึ่งมีแนวโน้มว่าจะเป็นผลมาจากความผันผวนที่เพิ่มขึ้นหลังจากการประกาศข่าวสำคัญๆ โซนกลับตัวที่เป็นไปได้: แนวต้าน: 1.2950

Isabel Clark 10:20 2025-04-07 UTC+2

การพยากรณ์รายสัปดาห์ตามการวิเคราะห์คลื่นที่เรียบง่ายสำหรับ EUR/USD, USD/JPY, GBP/JPY, USD/CAD, NZD/USD และ ทองคำ – 7 เมษายน

EUR/USD วิเคราะห์: ตั้งแต่เดือนกุมภาพันธ์ ราคาของเงินยูโรได้เคลื่อนไหวตามรูปแบบคลื่นขาขึ้น ในช่วงเดือนที่ผ่านมา โครงสร้างคลื่นได้เกิดเป็นรูปแบบระนาบที่ยืดออกมา จุดสูงต่ำสุดในกราฟได้ก่อตัวเป็น "สามเหลี่ยมขยาย" ในขณะนี้ ส่วนสุดท้ายของคลื่น (C) กำลังพัฒนาอยู่ คาดการณ์: ราคามีแนวโน้มเคลื่อนไหวในลักษณะขวางภายในแนวต้านกัน ขึ้นทางเป็นไปได้ในช่วงต้นสัปดาห์

Isabel Clark 10:10 2025-04-07 UTC+2

การวิเคราะห์ EUR/USD ในวันที่ 2 เมษายน 2025

รูปแบบคลื่นบนกราฟ 4 ชั่วโมงของ EUR/USD กำลังจะเปลี่ยนเป็นโครงสร้างที่ซับซ้อนมากขึ้น ตั้งแต่วันที่ 25 กันยายนของปีที่แล้ว โครงสร้างคลื่นขาลงใหม่ได้เริ่มก่อตัวขึ้น เป็นรูปแบบห้าคลื่น และเมื่อสามเดือนที่ผ่านมามีโครงสร้างการปรับตัวขึ้นที่เริ่มก่อตัวขึ้น ซึ่งควรจะประกอบด้วยคลื่นอย่างน้อยสามคลื่น ลูกคลื่นอันแรกของการปรับตัวนี้มีรูปร่างที่ชัดเจน ดังนั้นฉันยังคาดหวังว่าคลื่นที่สองจะตามมาด้วยโครงสร้างที่ชัดเจน อย่างไรก็ตาม

Chin Zhao 20:25 2025-04-02 UTC+2

การวิเคราะห์ GBP/USD วันที่ 2 เมษายน 2025

รูปแบบคลื่นของ GBP/USD ยังคงค่อนข้างไม่ชัดเจน แต่โดยทั่วไปจัดการได้ดี ขณะนี้มีความเป็นไปได้สูงที่แนวโน้มขาลงระยะยาวกำลังก่อตัวขึ้น คลื่น 5 ได้มีรูปทรงที่ชัดเจน ดังนั้นผมถือว่าคลื่นใหญ่อันดับที่ 1 เสร็จสมบูรณ์ หากสมมุติฐานนี้ถูกต้อง คลื่นอันดับที่ 2 กำลังอยู่ในกระบวนการของการก่อตัว

Chin Zhao 20:23 2025-04-02 UTC+2
หากไม่สะดวกคุยในตอนนี้
ระบุคำถามไว้ได้ใน แชท.
Widget callback
 

Dear visitor,

Your IP address shows that you are currently located in the USA. If you are a resident of the United States, you are prohibited from using the services of InstaFintech Group including online trading, online transfers, deposit/withdrawal of funds, etc.

If you think you are seeing this message by mistake and your location is not the US, kindly proceed to the website. Otherwise, you must leave the website in order to comply with government restrictions.

Why does your IP address show your location as the USA?

  • - you are using a VPN provided by a hosting company based in the United States;
  • - your IP does not have proper WHOIS records;
  • - an error occurred in the WHOIS geolocation database.

Please confirm whether you are a US resident or not by clicking the relevant button below. If you choose the wrong option, being a US resident, you will not be able to open an account with InstaForex anyway.

We are sorry for any inconvenience caused by this message.