empty
14.05.2022 03:39 PM
Analysis of GBP/USD on May 14

This image is no longer relevant

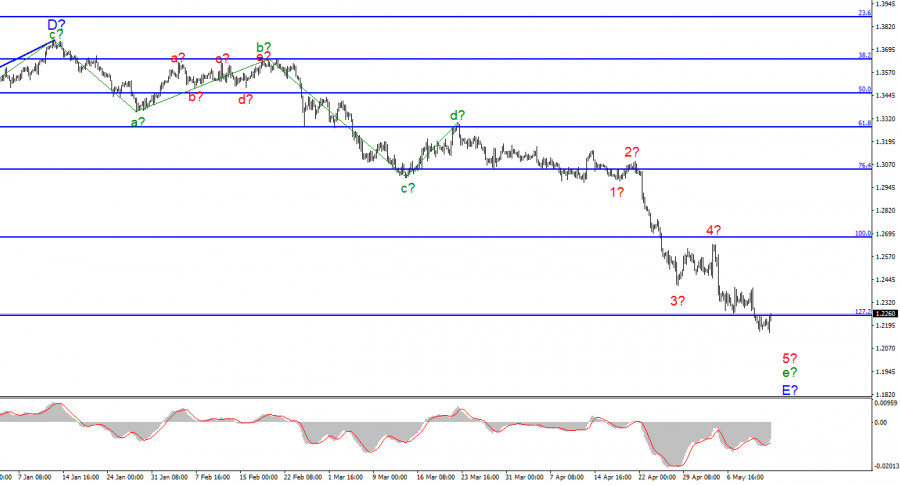
For the pound/dollar instrument, the wave markup continues to look very convincing and does not require adjustments. The downward section of the trend continues its construction within the framework of the wave e-E, and its internal wave marking looks quite complicated. Nevertheless, I have identified five waves inside this wave and, if my markup is correct, then wave 5, the last internal wave, is being built at this time. Thus, we get almost identical wave markings for the British and the European, each of which indicates the possible imminent completion of the downward trend section. Or everyone will have to take a much more complex and extended view, which can be facilitated by a weak news background or a complex geopolitical one. The wave 5-e-E may already be completed, but a successful attempt to break through the 1.2245 mark, which corresponds to 127.2% Fibonacci, indirectly indicates the opposite. However, now this wave can end at any moment, regardless of breakthroughs. If the current wave marking does not become more complicated, then the decline in the British dollar may be completed in the near future. At the moment, however, the market is not making any attempts to do this.The Briton will try to do without new complications of the wave pattern.

The exchange rate of the pound/dollar instrument increased by 60 basis points on May 13. The news background on this day was insignificant. All the main economic news came out on Thursday: GDP and industrial production in the UK. And a day earlier - inflation in the United States. Thanks to these reports, the British dollar fell in price by about 150 more basis points. However, the most resonant topic of this week was rumored that the Bank of England may take a break in raising rates. I can't say how much these rumors have affected the mood of the market, but I don't see anything terrible in them. The Bank of England has raised the rate four times in a row, so a pause for 1-2 months looks normal. Now we need to evaluate the results of these increases to then decide on the need for a new tightening of monetary policy. However, the market is not too diligent now to understand all the background of the PEPP or economic data. There is a reason to sell - sell. Such a motto now clearly appeals to most of the market.

In contrast to this mood, a wave pattern works, which assumes the completion of the construction of a downward trend section. It is important that the wave patterns of the European and the British now almost completely coincide. You can count on the completion of downward trends for both instruments. Agree, it would be strange if a European started an upward trend, but a Briton did not. Next week, the UK will release a report on unemployment, average wages, inflation, and retail trade. I think the most important thing right now is inflation. Not so long ago, the Bank of England gave a forecast for inflation for 2022 - 10.25%. Forecasts say that by the end of April, inflation will rise to 9%. Thus, the figure of 10.25% does not even look excessively high. The higher the growth, the more likely the Bank of England will refuse to pause in raising the interest rate. And this factor can support the demand for the British currency.

General conclusions.

The wave pattern of the pound/dollar instrument still assumes the completion of the construction of wave E. Now I also advise selling the instrument with targets located near the 1.1704 mark, which corresponds to 161.8% Fibonacci, since the attempt to break through the 1.2246 mark turned out to be successful. However, the construction of a downward section of the trend is nearing its completion and the mark of 1.2246 looks very good for the trend to end near it. A break of this mark from the bottom up will be a signal to close sales and, possibly, to open small purchases.

This image is no longer relevant

At the higher scale, the entire downward trend section looks fully equipped. Therefore, the continuation of the decline of the instrument below the 22nd figure is far from obvious. Wave E has taken a five-wave form and looks quite complete.

Chin Zhao,
ผู้เชี่ยวชาญด้านการวิเคราะห์ของ InstaForex
© 2007-2025
Summary
Urgency
Analytic
Alexander Dneprovskiy
Start trade
รับผลกำไรจากการเปลี่ยนแปลงอัตราสกุลเงินดิจิทัลกับ InstaForex.
ดาวน์โหลด MetaTrader 4 และเปิดการซื้อขายครั้งแรกของคุณ.
USD/JPY: การวิเคราะห์และการคาดการณ์ วันนี้สกุลเงินญี่ปุ่นกำลังดึงดูดผู้ซื้อ แต่ยังคงต้องระวังการปรับนโยบายทางการเงินของธนาคารกลางญี่ปุ่นท่ามกลางท่าทีสนับสนุนการกระตุ้นเศรษฐกิจของนายกรัฐมนตรี Sanae Takaichi และความต้องการคงอัตราดอกเบี้ยต่ำ ซึ่งลดผลกระทบจากการแถลงของผู้ว่าการธนาคารกลางญี่ปุ่น Kazuo Ueda ที่ได้ชี้ให้เห็นว่าอัตราเงินเฟ้อกำลังเร่งตัวและใกล้กับเป้าหมาย 2% ซึ่งยังคงกดดันอัตราแลกเปลี่ยนเงินเยน แรงหนุนเพิ่มเติมมาจากความคาดหวังเกี่ยวกับการกลับมาดำเนินการของรัฐบาลกลางสหรัฐฯ ซึ่งได้ลดเสน่ห์ของเงินเยนในฐานะสกุลเงินปลอดภัย ในขณะเดียวกัน การลดค่าของเงินเยนในประเทศไทยช่วงนี้ได้สร้างความกังวลให้กับรัฐมนตรีว่าการกระทรวงการคลัง
XAU/USD: การวิเคราะห์และการพยากรณ์ วันนี้ราคาทองคำได้หยุดที่ระดับ 4,200 ดอลลาร์ โดยเป็นการปรับตัวทางแนวระนาบก่อนจะเคลื่อนไหวครั้งต่อไป นักลงทุนดูเหมือนจะมั่นใจในข้อมูลเศรษฐกิจมหภาคของสหรัฐฯ ที่จะแสดงให้เห็นถึงสัญญาณการชะลอตัวของเศรษฐกิจ เนื่องจากการปิดตัวของรัฐบาล ซึ่งอาจทำให้ Federal Reserve พิจารณาการปรับลดอัตราดอกเบี้ยเพิ่มเติมในเดือนธันวาคม สถานการณ์นี้สนับสนุนราคาของโลหะมีค่า แนวโน้มการขายเงินดอลลาร์สหรัฐฯ ที่ต่อเนื่องก็เป็นอีกปัจจัยที่สนับสนุนมูลค่าของทองคำ ในขณะที่ความคาดหวังในเชิงบวกจากการเปิดใหม่ของรัฐบาลกลางกลับมีผลกระทบที่น้อยต่อบรรดานักลงทุน
  • Grand Choice
    Contest by
    InstaForex
    InstaForex always strives to help you
    fulfill your biggest dreams.
    เข้าร่วมการแข่งขัน


บทความแนะนำ

การวิเคราะห์ GBP/USD วันที่ 12 พฤศจิกายน 2025

รูปแบบคลื่นสำหรับ GBP/USD ยังคงแสดงถึงการก่อตัวของช่วงแนวโน้มขาขึ้น (ดูกราฟที่ต่ำกว่า) อย่างไรก็ตาม ในช่วงไม่กี่สัปดาห์ที่ผ่านมา มันมีรูปแบบที่ซับซ้อนและคลุมเครือ (ดูกราฟที่บนสุด) ค่าเงินปอนด์ร่วงลงอย่างรุนแรง ซึ่งทำให้ช่วงแนวโน้มที่เริ่มต้นในวันที่ 1 กรกฎาคมดูไม่แน่นอน ช่วงนี้สามารถมองว่าเป็นคลื่นที่

Chin Zhao 20:35 2025-11-12 UTC+2

วิเคราะห์ EUR/USD ประจำวันที่ 12 พฤศจิกายน 2025

รูปแบบคลื่นในกราฟ 4 ชั่วโมงของ EUR/USD ได้เปลี่ยนไปแล้ว — น่าเสียดายที่ยังไม่เข้าทางที่ดีนัก ช่วงของแนวโน้มขาขึ้นที่เริ่มขึ้นในเดือนมกราคม 2025 ยังคงอยู่ แต่รูปแบบคลื่นตั้งแต่วันที่ 1 กรกฎาคม กลับซับซ้อนและขยายออกไป ในมุมมองของผม

Chin Zhao 20:31 2025-11-12 UTC+2

การวิเคราะห์ EUR/USD วันที่ 11 พฤศจิกายน 2025

รูปแบบคลื่นบนกราฟ 4 ชั่วโมงสำหรับ EUR/USD ได้พัฒนาไปแล้ว — น่าเสียดายที่ไม่ใช่ในทางที่ดีที่สุด ยังเร็วเกินไปที่จะพูดถึงการยกเลิกช่วงแนวโน้มขาขึ้นที่เริ่มต้นในเดือนมกราคมปี 2025 แต่ตั้งแต่วันที่ 1 กรกฎาคม รูปแบบคลื่นได้ซับซ้อนและยืดเยื้ออย่างมาก ในมุมมองของฉัน ขณะนี้เครื่องมือกำลังสร้างคลื่นแก้ไขที่

Chin Zhao 21:24 2025-11-11 UTC+2

การวิเคราะห์ EUR/USD วันที่ 10 พฤศจิกายน 2025

รูปแบบคลื่นบนกราฟ EUR/USD แบบ 4 ชั่วโมงได้เปลี่ยนไป — น่าเสียดายที่ไม่ได้เปลี่ยนไปในทางที่ดีขึ้น แม้ยังไม่มีเหตุผลที่จะยกเลิกแนวโน้มขาขึ้นที่เริ่มขึ้นในเดือนมกราคม 2025 แต่รูปแบบคลื่นนับตั้งแต่วันที่ 1 กรกฎาคมได้กลายเป็นที่ซับซ้อนมากขึ้นและยาวนานขึ้น ในมุมมองของฉัน ขณะนี้เครื่องมือกำลังสร้างคลื่น

Chin Zhao 21:14 2025-11-10 UTC+2

การคาดการณ์รายสัปดาห์ตามการวิเคราะห์คลื่นอย่างง่ายสำหรับ GBP/USD, AUD/USD, USD/CHF, EUR/JPY, EUR/CHF และ EUR/GBP — วันที่ 9 พฤศจิกายน

GBP/USD การวิเคราะห์โดยย่อ: บนกราฟค่าเงินปอนด์อังกฤษ ได้มีการเกิดคลื่นการปรับฐานลงต่อเนื่องตั้งแต่วันที่ 26 กันยายน โครงสร้างของคลื่นนี้กำลังพัฒนาเป็นรูปแบบ flat ที่ขยายออกไปและใกล้จะเสร็จสมบูรณ์แล้ว ขณะนี้ยังไม่พบสัญญาณการกลับทิศทางใด ๆ ราคาสามารถเด้งกลับจากขอบบนของโซนแนวโน้มกลับทิศทางที่แข็งแกร่งในกรอบเวลายาวรายวันได้ การคาดการณ์รายสัปดาห์: ในช่วงต้นสัปดาห์ที่กำลังจะมาถึงนี้ คาดว่าค่าเงินปอนด์อังกฤษจะทำการเคลื่อนไหวไปสู่โซนแรงต้านให้เสร็จสิ้น

Isabel Clark 08:57 2025-11-10 UTC+2

การพยากรณ์รายสัปดาห์ตามการวิเคราะห์คลื่นแบบง่ายสำหรับ EUR/USD, USD/JPY, GBP/JPY, USD/CAD, NZD/USD, และ Gold — วันที่ 9 พฤศจิกายน

EUR/USD การวิเคราะห์: ในระยะสั้น คู่หลักของสกุลเงินยุโรปยังคงสร้างโครงสร้างคลื่นขาขึ้นต่อเนื่อง ซึ่งเริ่มต้นขึ้นตั้งแต่ต้นเดือนมีนาคมปีนี้ ในช่วงหลายเดือนที่ผ่านมาได้มีการพัฒนาเฟสของการปรับฐานในโครงสร้างนี้ ค่า extremums ของคลื่นได้สร้างรูปแบบก้างปลาแนวนอนบนกราฟ ขณะนี้โครงสร้างคลื่นอยู่ในช่วงสุดท้ายของการก่อตัว และราคากำลังเคลื่อนที่ไปยังโซนแนวรับในกรอบเวลารายวัน การคาดการณ์: ในสัปดาห์ที่จะถึงนี้ การเคลื่อนไหวของยูโรคาดว่าจะคงอยู่ในแนวข้างเป็นส่วนใหญ่ ในอีกไม่กี่วันข้างหน้าอาจมีการลดลงและแรงกดดันทันทีที่แนวรับ

Isabel Clark 08:51 2025-11-10 UTC+2

การวิเคราะห์ GBP/USD วันที่ 7 พฤศจิกายน 2025

สำหรับคู่เงิน GBP/USD โครงสร้างของคลื่นยังคงบ่งชี้ถึงการก่อตัวของแนวโน้มขาขึ้น (ดูกราฟล่าง) แม้ว่าในช่วงไม่กี่สัปดาห์ที่ผ่านมาจะมีรูปแบบที่ซับซ้อนและคลุมเครือมากขึ้น (ดูกราฟบน) ในขณะที่ค่าเงินปอนด์ลดลงอย่างรวดเร็ว ทำให้แนวโน้มที่เริ่มขึ้นเมื่อวันที่ 1 สิงหาคมดูไม่แน่นอน เป็นไปได้ว่าคลื่น c ของคลื่นที่ 4 นั้นมีลักษณะคล้ายกับรูปแบบห้าคลื่นที่เป็นคลื่นปรับแก้

Chin Zhao 21:59 2025-11-07 UTC+2

การวิเคราะห์ EUR/USD วันที่ 7 พฤศจิกายน 2025

รูปแบบคลื่นในแผนภูมิ EUR/USD 4 ชั่วโมงมีการเปลี่ยนแปลง — น่าเสียดายที่ไม่ดีขึ้น การจะสรุปว่าเซ็กเมนต์ขาขึ้นของแนวโน้มสิ้นสุดแล้วนั้นยังเร็วเกินไป แต่การลดลงล่าสุดของยูโรทำให้ต้องทำการพิจารณารูปแบบคลื่นใหม่ ขณะนี้เราสามารถสังเกตเห็นชุดโครงสร้างการปรับตัวซึ่งอาจเป็นส่วนหนึ่งของคลื่นใหญ่ 4 ภายในแนวโน้มขาขึ้นที่กว้างกว่า ในกรณีนี้ คลื่น 4 มีรูปแบบที่ขยายยาวออกไปอย่างไม่ปกติ

Chin Zhao 21:46 2025-11-07 UTC+2

การวิเคราะห์คู่เงิน EUR/USD วันที่ 6 พฤศจิกายน 2025

รูปแบบคลื่นบนกราฟ 4 ชั่วโมงสำหรับ EUR/USD ได้เปลี่ยนไป—และน่าเสียดายที่ไม่ใช่ผลดีเลย ยังเร็วเกินไปที่จะสรุปว่าภาคแนวโน้มขาขึ้นถูกยกเลิก แต่การลดลงของยูโรล่าสุดทำให้จำเป็นต้องปรับโครงสร้างคลื่นใหม่ ตอนนี้เราเห็นเป็นชุดรูปแบบการปรับตัวซึ่งอาจจะเป็นส่วนหนึ่งของคลื่นลูกที่ 4 ที่ใหญ่ขึ้นภายในแนวโน้มขาขึ้นโดยรวม ในกรณีนั้น คลื่นลูกที่ 4 ได้มีรูปร่างที่ยาวนานผิดปกติ แม้ว่าโดยรวมแล้วรูปแบบคลื่นยังคงไม่ผิดเพี้ยน

Chin Zhao 21:01 2025-11-06 UTC+2

การวิเคราะห์ EUR/USD วันที่ 5 พฤศจิกายน 2025

โครงสร้างคลื่นบนกราฟ EUR/USD ระยะ 4 ชั่วโมงเปลี่ยนแปลง — น่าเสียดายที่ไม่ใช่ไปในทางที่ดีขึ้น ตอนนี้ยังเร็วเกินไปที่จะสรุปว่าแนวโน้มขาขึ้นถูกยกเลิก แต่การลดลงล่าสุดของยูโรทำให้จำเป็นต้องปรับคลื่นนับ เราพบชุดโครงสร้างการปรับฐาน สามารถสันนิษฐานได้ว่าพวกมันเป็นส่วนหนึ่งของคลื่นหลัก 4 ภายในแนวโน้มขาขึ้น ในกรณีนี้ คลื่น

Chin Zhao 18:30 2025-11-05 UTC+2
หากไม่สะดวกคุยในตอนนี้
ระบุคำถามไว้ได้ใน แชท.
Widget callback
 

Dear visitor,

Your IP address shows that you are currently located in the USA. If you are a resident of the United States, you are prohibited from using the services of InstaFintech Group including online trading, online transfers, deposit/withdrawal of funds, etc.

If you think you are seeing this message by mistake and your location is not the US, kindly proceed to the website. Otherwise, you must leave the website in order to comply with government restrictions.

Why does your IP address show your location as the USA?

  • - you are using a VPN provided by a hosting company based in the United States;
  • - your IP does not have proper WHOIS records;
  • - an error occurred in the WHOIS geolocation database.

Please confirm whether you are a US resident or not by clicking the relevant button below. If you choose the wrong option, being a US resident, you will not be able to open an account with InstaForex anyway.

We are sorry for any inconvenience caused by this message.