empty
01.07.2022 10:40 AM
EUR/USD analysis and forecast for July 1, 2022

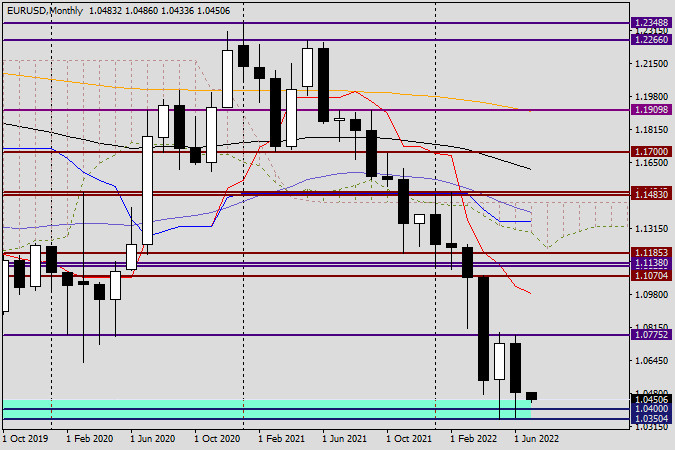
As a result, the first month of trading in the summer has ended. We must acknowledge that the primary currency pair EUR/USD finished on a rather sad note. The US dollar is still strong, as demonstrated at the June auction when it faced up against all except the Swiss franc's primary rivals. However, this is entirely another tale. And I recommend looking at the most senior timeframe and summarizing the month's outcomes that ended yesterday in today's article on the euro/dollar.

Monthly

This image is no longer relevant

You will first notice the major support area near 1.0350, which is now indubitably historical. The fall, which had already been noticed in 2017, was stopped by this sturdy technical level, as is evident on the chart. I recall that occasion and how parity, or the level of 1.0000, was expected for the euro/dollar at that time. Instead, the pair took action, turned upward, and not only turned around but also grew decently, rising to the level of 1.2555. Following that, both ups and downs were seen in the price dynamics of the EUR/USD, and as a result of all these moves, the quote fell back to levels last seen five years ago. The relatively large shadows of the last two monthly candles amply illustrate the strength of the 1.0350 level. But nothing endures forever. Once more, I'd guess that the pair would indeed move quickly toward parity in the event of a true collapse of the 1.0350-1.0300 price range. The ending of July trading above 1.0775 will likely pave the way for higher prices, possibly even to the Tenkan red line, which is positioned at 1.0983, or to another significant historical and technical level of 1.1000. This is easy to predict, given the lows and highs of the previous month. If the July trades close at 1.0339 (the January 2017 lows), the pair will undoubtedly anticipate a route to the south, whose ferocity will only grow.

Daily

This image is no longer relevant

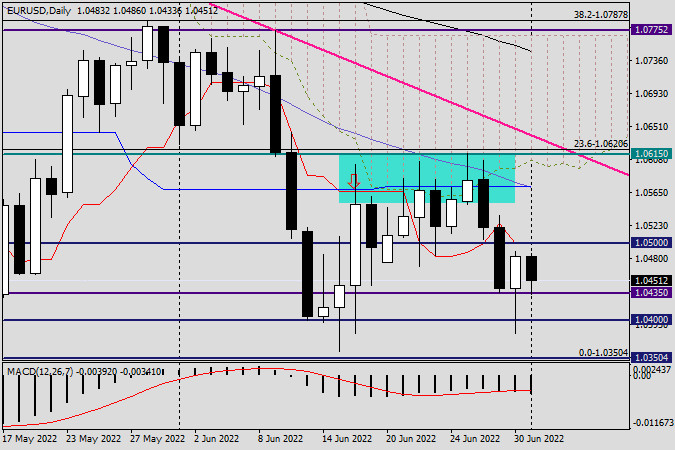
The EUR/USD pair displayed resilience throughout yesterday's trade. After attempting to breach another important key of 1.0400, it found firm support at 1.0383 and figuratively rose from the ashes to close Thursday's session at 1.0483. However, as the euro/dollar is currently trading below the red line of the Tenkan Ichimoku indicator, which is directly at this crucial level and the major psychological level of 1.0500, negative risks for the pair still exist. In this regard, it will be fascinating to see how the market will respond to today's eurozone inflation figures. I want to remind you that all versions of the eurozone consumer price index, including their base value, will be released at 10:00 London time. Since the European regulator has launched and postponed the issue of high inflation, I assume that the growth of consumer prices in the eurozone will be comparable to and, in some cases, even exceeding forecasts. This will support the single currency because it will be clearer that the ECB needs to turn its words into deeds. If technology is our only point of interest, then the bullish candle from yesterday with its lengthy lower shadow provides every reason to anticipate that the EUR/USD expansion may continue today. However, as is customary on the final trading day of the week, I won't provide any specific suggestions for trading. I assure you that this is not the ideal time.

เลือกช่วงเวลา
5
นาที
15
นาที
30
นาที
1
ชั่วโมง
4
ชั่วโมง
1
วัน
1
สัปดาห์
รับผลกำไรจากการเปลี่ยนแปลงอัตราสกุลเงินดิจิทัลกับ InstaForex.
ดาวน์โหลด MetaTrader 4 และเปิดการซื้อขายครั้งแรกของคุณ.
ควรใส่ใจอะไรในวันที่ 21 พฤษภาคม? การวิเคราะห์เหตุการณ์สำคัญสำหรับมือใหม่ เหตุการณ์เศรษฐกิจมหภาคที่กำหนดไว้ในวันพุธนั้นมีน้อย อย่างไรก็ตาม รายงานเงินเฟ้อจากสหราชอาณาจักรมีความสำคัญต่อการตลาด หรือที่ถูกต้องกว่านั้นคือ เคยสำคัญ . ดังที่เห็นได้ นักเทรดยังคงเมินเฉยต่อข้อมูลเศรษฐกิจมหภาคและปัจจัยพื้นฐาน ขายเงินดอลลาร์เมื่อมีโอกาสทุกครั้ง ตามการประเมินของผู้เชี่ยวชาญ ดัชนีราคาผู้บริโภคในสหราชอาณาจักรอาจเร่งตัวขึ้นเป็น 3.3% ในเดือนเมษายน ซึ่งแน่นอนว่าเป็นปัจจัยบวกต่อเงินปอนด์ เพราะธนาคารกลางอังกฤษอาจจะหยุดการผ่อนคลายนโยบายการเงินเป็นเวลานานหากเงินเฟ้อเพิ่มขึ้นแบบนี้
  • Grand Choice
    Contest by
    InstaForex
    InstaForex always strives to help you
    fulfill your biggest dreams.
    เข้าร่วมการแข่งขัน


บทความแนะนำ

การวิเคราะห์เชิงเทคนิคของการเคลื่อนไหวของราคาในระหว่างวันของคู่เงินครอส AUD/JPY, วันพุธที่ 21 พฤษภาคม 2025

ถึงแม้ว่าบนกราฟ 4 ชั่วโมง คู่สกุลเงินครอส AUD/JPY กำลังอ่อนตัวลง ดูเหมือนว่าการอ่อนตัวนี้เป็นเพียงการปรับฐานชั่วคราว ตราบเท่าที่มันยังไม่ทะลุผ่านและปิดต่ำกว่าระดับ 91.47 ก็ยังมีโอกาสที่ AUD/JPY จะกลับมาแข็งค่าขึ้นไปที่ระดับ 93.79 และหากแรงผลักดันและความผันผวนสนับสนุน ก็มีโอกาสที่

Arief Makmur 06:25 2025-05-21 UTC+2

วิเคราะห์ทางเทคนิคของการเคลื่อนไหวของราคาภายในวัน เครื่องมือสินค้าโภคภัณฑ์เงิน, วันพุธที่ 21 พฤษภาคม 2025

ในกราฟ 4 ชั่วโมง เครื่องมือสินค้าโภคภัณฑ์เงินดูเหมือนจะแสดงให้เห็นถึงการบรรจบกันระหว่างการเคลื่อนไหวของราคาสินค้าโภคภัณฑ์เงินและตัวบ่งชี้ Stochastic Oscillator ซึ่งในช่วงเวลาอันใกล้นี้เงินมีศักยภาพที่จะปรับตัวแข็งค่าขึ้นไปถึงระดับ 33,175 เป็นเป้าหมายหลัก และ 33,596 เป็นเป้าหมายถัดไป หากความผันผวนและโมเมนตัมในการแข็งค่าและความผันผวนให้การสนับสนุน แต่เนื่องจากตัวบ่งชี้ Stochastic

Arief Makmur 06:25 2025-05-21 UTC+2

การคาดการณ์ EUR/USD สำหรับวันที่ 21 พฤษภาคม 2025

ในวันอังคารที่ผ่านมา ยูโรสร้างตัวแข็งขันอยู่เหนือเส้นบอกสมดุลในระดับวัน ปิดวันด้วยการอยู่เหนือระดับแนวต้านที่ 1.1266 และเริ่มต้นวันนี้ด้วยการเคลื่อนไหวในทิศทางขาขึ้น ขณะนี้ ฝ่ายตลาดกระทิงกำลังมุ่งเป้าไปที่ระดับ 1.1420 ออสซิลเลเตอร์ Marlin กำลังจะเข้าสู่เขตบวกเพื่อเข้าร่วมกับการเคลื่อนไหวขาขึ้น และสนับสนุนการทะลุผ่านเหนือระดับ 1.1420 จากนั้นเราคาดว่าการเติบโตจะดำเนินต่อไปสู่ระดับ 1.1535

Laurie Bailey 05:19 2025-05-21 UTC+2

การพยากรณ์ GBP/USD สำหรับวันที่ 21 พฤษภาคม 2025

ตลอดสัปดาห์ที่ผ่านมา เงินปอนด์อังกฤษมีการเคลื่อนไหวที่ก้าวหน้าเมื่อเทียบกับสกุลเงินอื่น ๆ แนวโน้มนี้อาจส่งผลให้เกิดการทะลุเหนือกรอบแนวโน้มขาขึ้นและระดับเป้าหมายที่ 1.3635 ในไม่ช้า ออสซิลเลเตอร์ Marlin เพิ่งเข้าสู่พื้นที่บวกเมื่อวันจันทร์ที่ผ่านมา และยังมีทางยาวข้างหน้า ศักยภาพในการเติบโตของเงินปอนด์ยังคงขยายไปถึง 1.3800 ซึ่งเป็นระดับแนวรับจากเดือนเมษายนถึงพฤษภาคม 2021 ขณะนี้ราคากำลังเตรียมตัวที่จะทะลุผ่านระดับ

Laurie Bailey 05:10 2025-05-21 UTC+2

การคาดการณ์ AUD/USD สำหรับวันที่ 21 พฤษภาคม 2025

การปรับลดอัตราดอกเบี้ยเมื่อวานนี้โดยธนาคารกลางออสเตรเลียจาก 4.10% เหลือ 3.85% แม้ว่าจะเป็นที่คาดการณ์กันอย่างกว้างขวาง แต่ก็ยังไม่สามารถทำให้ดอลลาร์ออสเตรเลียยืนเหนือระดับแนวต้าน 0.6444 ได้ อย่างไรก็ตาม เมื่อถึงระดับแนวรับที่ 0.6394 ราคาได้ดีดตัวขึ้นอย่างรวดเร็ว ขณะนี้ "Aussie" กำลังพยายามทะลุผ่านระดับ

Laurie Bailey 05:10 2025-05-21 UTC+2

การคาดการณ์สำหรับ USD/CAD ในวันที่ 21 พฤษภาคม 2025

คู่เงิน USD/CAD ได้ค่อยๆ ลดลงมาติดต่อกันห้าวัน โดยยังคงอยู่ต่ำกว่าเส้นตัวบ่งชี้สมดุลรายวัน การเคลื่อนไหวต่ำกว่าระดับแนวรับที่ 1.3898 จะเป็นการเร่งการปรับตัวลงไปยังแนวรับแรกที่ 1.3746 ซึ่งต่ำกว่านั้นเล็กน้อยคือเส้นช่องราคาอยู่ที่ 1.3707 นอกจากนี้ ตัวออสซิลเลเตอร์ของ Marlin อาจเข้าสู่เขตลบในไม่ช้า

Laurie Bailey 05:07 2025-05-21 UTC+2

การคาดการณ์ราคาน้ำมันสำหรับวันที่ 21 พฤษภาคม 2025

เช้าวันนี้ บนกราฟรายวัน ราคาได้เจาะเส้น MACD ด้วยเงาด้านบน ดูด้วยสายตาแนวโน้มเป็นขาขึ้น และเส้นสัญญาณของออสซิลเลเตอร์ Marlin ก็ชี้ขึ้นเช่นกัน ยังคงอยู่ในโซนของการเติบโต อย่างไรก็ตาม สัญญาณเหล่านี้ทั้งหมดอาจหลอกตาได้ อุปสรรคหลักในการเติบโตต่อไปคือระดับที่แข็งแกร่งที่ 65.15 ซึ่งเป็นพื้นที่แนวต้านมาตั้งแต่ช่วงครึ่งหลังของเดือนเมษายนและเป็นโซนสนับสนุนตั้งแต่ช่วงหนึ่งในสามแรกของเดือนมีนาคม

Laurie Bailey 05:06 2025-05-21 UTC+2

สัญญาณการซื้อขายสำหรับทองคำ (XAU/USD) ระหว่างวันที่ 20-22 พฤษภาคม 2025: ขายต่ำกว่า $3,281 (20 EMA - 6/8 Murray)

ในช่วงเริ่มต้นของตลาดอเมริกา ราคาทองคำซื้อขายอยู่ราว 3,281 หลังจากมีการเคลื่อนไหวขึ้นอย่างแข็งแกร่งจากการเบรกเอ้าท์ของช่องแนวโน้มขาลง ขณะนี้ราคาทองคำซื้อขายอยู่เหนือค่า EMA 200 และ SMA 21 ซึ่งบ่งชี้ว่าราคาอาจยังคงเพิ่มขึ้นในอีกไม่กี่วันข้างหน้า มีแนวต้านที่แข็งแกร่งอยู่ที่บริเวณ 6/8 Murray ซึ่งอยู่ที่

Dimitrios Zappas 18:58 2025-05-20 UTC+2

สัญญาณการซื้อขายสำหรับ EUR/USD ระหว่างวันที่ 20-22 พฤษภาคม 2025: ขายต่ำกว่า 1.1270 (200 EMA - 21 SMA)

ในช่วงต้นของการซื้อขายฝั่งอเมริกา คู่เงิน EUR/USD เคลื่อนไหวอยู่ราวๆ 1.1257 เป็นการแสดงให้เห็นถึงความแข็งแกร่งที่อ่อนล้าของทิศทางขาขึ้น และอยู่ต่ำกว่าช่องแนวโน้มขาลง คาดการณ์ว่าจะมีการปรับฐานทางเทคนิคในอีกไม่กี่วันข้างหน้า ในช่วงการซื้อขายฝั่งยุโรป ยูโรพยายามที่จะออกจากช่องแนวโน้มขาลงแต่ไม่สามารถทำได้ เราเชื่อว่าการลดลงอย่างมากอาจเกิดขึ้นในไม่กี่วันข้างหน้า โดยอาจถึงระดับทางจิตวิทยาที่ 1.10 ดังนั้นเราจะหาช่องทางในการขายยูโรที่ต่ำกว่า 1.1270

Dimitrios Zappas 18:56 2025-05-20 UTC+2

การพยากรณ์อัตราแลกเปลี่ยน EUR/USD สำหรับวันที่ 20 พฤษภาคม 2025

เมื่อวันจันทร์ คู่สกุลเงิน EUR/USD ได้กลับทิศทางให้สอดคล้องกับเงินยูโรและกลับมาอีกครั้งเป็นครั้งที่สามยังโซนแนวต้านที่ระดับ 1.1265–1.1282 การเด้งกลับใหม่จากโซนนี้ไม่ได้ทำให้เกิดการเคลื่อนไหวของฝั่งขาลงซึ่งดูเหมือนจะพอใจกับการงานที่เสร็จสิ้นที่ระดับ 1.1081 แม้จะไม่มีข้อมูลสำคัญในวันจันทร์ แต่ฝั่งขาขึ้นยังคงบุกเข้าโจมตีราวกับว่า Donald Trump ได้กลาวถึงการตั้งภาษีใหม่หรือไล่ Jerome Powell

Samir Klishi 11:29 2025-05-20 UTC+2
หากไม่สะดวกคุยในตอนนี้
ระบุคำถามไว้ได้ใน แชท.
Widget callback
 

Dear visitor,

Your IP address shows that you are currently located in the USA. If you are a resident of the United States, you are prohibited from using the services of InstaFintech Group including online trading, online transfers, deposit/withdrawal of funds, etc.

If you think you are seeing this message by mistake and your location is not the US, kindly proceed to the website. Otherwise, you must leave the website in order to comply with government restrictions.

Why does your IP address show your location as the USA?

  • - you are using a VPN provided by a hosting company based in the United States;
  • - your IP does not have proper WHOIS records;
  • - an error occurred in the WHOIS geolocation database.

Please confirm whether you are a US resident or not by clicking the relevant button below. If you choose the wrong option, being a US resident, you will not be able to open an account with InstaForex anyway.

We are sorry for any inconvenience caused by this message.