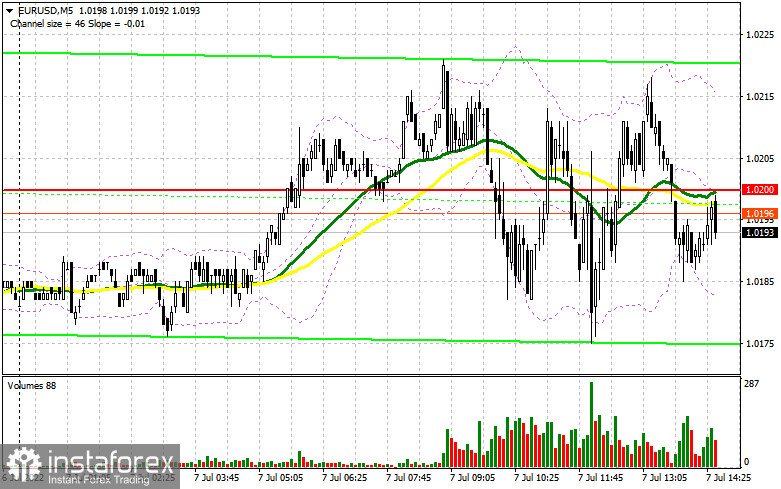
In the morning article, I highlighted the level of 1.0200 and recommended taking decisions with this level in focus. Now let's look at the 5-minute chart and try to figure out what actually happened. The speeches of ECB officials did not affect the trajectory of the euro. Traders are still refraining from buying it even at swing lows. It was not possible to determine good entry points from 1.0200. However, this level was broken. In the afternoon, the technical outlook changed slightly.
What is needed to open long positions on EUR/USD
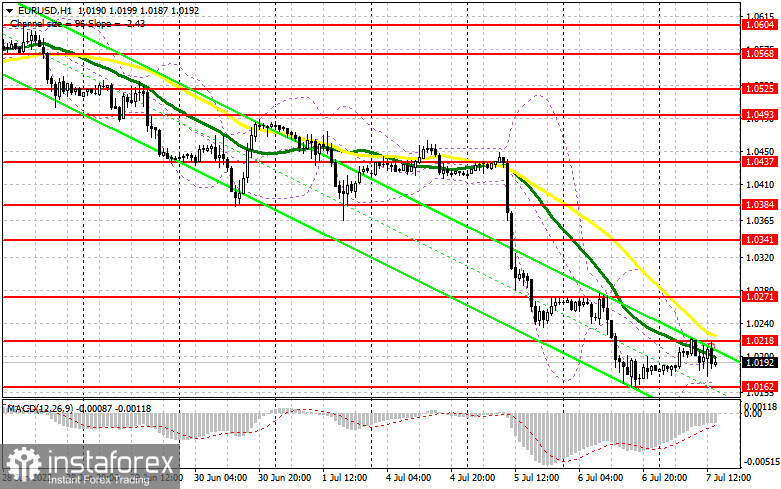
In the American session, the US will release a batch of reports on the labor market. They are likely to spur up market volatility. It is recommended to pay attention to the ADP report, which reflects the change in total US nonfarm private employment. Apart from that, traders will definitely take notice of initial jobless claims data. Notably, the US will hardly lose momentum even if macro stats are weak. It is now growing steadily as a safe-haven asset amid a rise in US Treasury yields. If the euro falls further after the release of the reports, it may reach the nearest support level of 1.0162. Only after a false breakout at this level, we can expect a buy signal, counting on a small upward correction to 1.0218. The moving averages are passing in the bearish territory at this level. Given that the divergence of the MACD has been already factored in by traders, it will be quite difficult for bulls to push the euro above this level. Only after a breakout and a downward test of 1.0218, there might be a buy signal. If so, it will ease most of the bears' stop-loss orders. As a result, the pair may return to the resistance level of 1.0271. The distant target will be the 1.0341 level. However, now, such a rise looks quite unlikely as there are no drivers. If EUR/USD declines and bulls show no activity at 1.0162, which is more likely, bearish pressure will only increase. In this case, I advise you not to stay wat from the market. It is better to open long positions only after a false breakout of the support level of 1.0119. It is recommended to open long positions on EUR/USD immediately at a bounce from the level of 1.0072 or even a low of 1.0033, keeping in mind an upward intraday correction of 30-35 pips.
What is needed to open short positions on EUR/USD
Bears remain in control, not allowing the pair to grow above 1.0281 in the first half of the day. If the euro rises during the US session after weak data on the US trade surplus and speeches by FOMC members Bullard and Waller, only a false breakout of 1.0218, like the one that occurred in the first half of the day, will give an excellent sell signal. If this scenario comes true, the pair may decline to the nearest support level of 1.0162, which is now the yearly low. A breakout and slide below this level, as well as an upward test, will generate an additional sell signal. It will also lead to a sharp drop in the buyers' stop-loss orders. It could reach a new yearly low of 1.0119. Bulls and bears are likely to fight fiercely for this level. After this level, bears will target 1.0033. If the price slips to it, it may signal the potential parity with the US dollar. It is a very gloomy prospect. This is why I would advise traders to lock in profits. A more distant target will be the 0.9994 level. If EUR/ USD climbs during the American session and bears show no energy at 1.0218, it will hardly affect the bearish momentum. In this case, it is better to cancel short positions until the 1.0271 level. A false breakout of this level will only strengthen the bearish trend. You can sell EUR/USD immediately at a bounce from a high of 1.0341 or even a high of 1.0384, keeping in mind a downward intraday correction of 30-35 pips.
COT
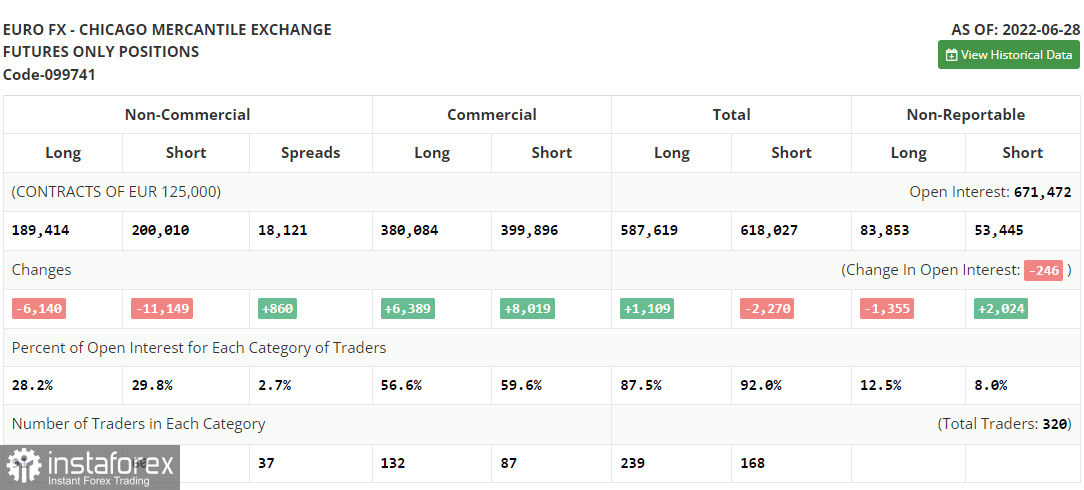
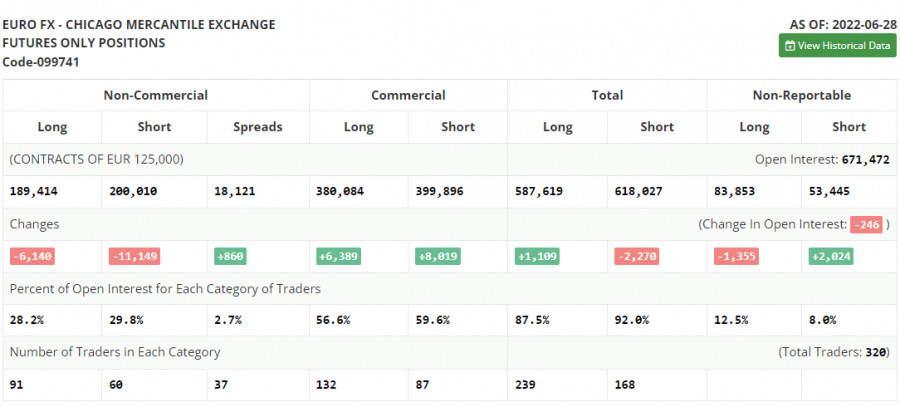
The COT report (Commitment of Traders) for June 28 again logged a drop in both long and short positions but it did lead to an increase in the negative delta. The number of short positions was lower than long ones. Last week, ECB President Christine Lagarde and Fed Chairman Jerome Powell made speeches. They stressed the need to tighten monetary policy to combat the highest inflation on record. This month, the ECB intends to start raising interest rates which should limit the upward potential of the US dollar against the euro. Eurozone inflation data released last week showed the regulator that they should urgently hike the key rate. However, given the headwinds in the global economy, demand for safe-haven assets is buoyant. Analysts are betting on the parity in the EUR/USD pair. The COT report revealed that the number of long non-commercial positions decreased by 6,140, to the level of 189,414, while the number of short non-commercial positions tumbled by 11,149 to the level of 200,010. The US dollar approaches new highs amid the low exchange rate of the euro, the need for further aggressive tightening by major central banks, and the recession in many developed countries. At the end of the week, the total non-commercial net position remained negative and amounted to -10,596 against -15,605. The weekly closing price dropped to 1.0584 against 1.0598.
Signals of technical indicators
Moving averages
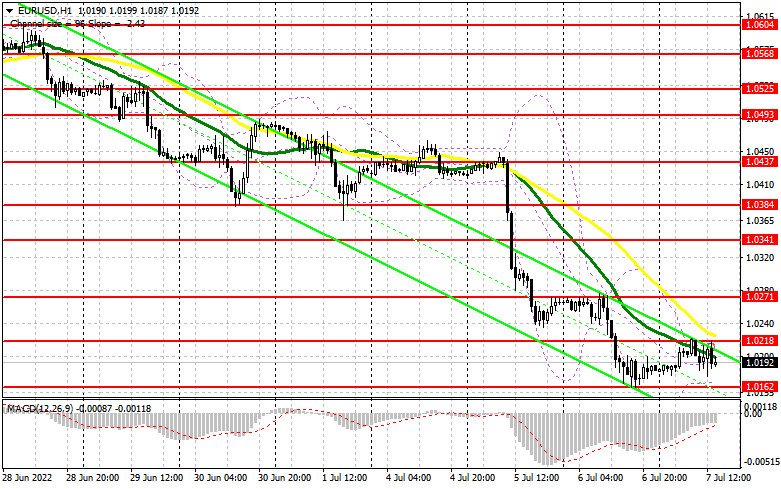
EUR/USD is trading below 30- and 50-period moving averages. It means that the euro is trading with a bearish bias.
Remark. The author is analyzing the period and prices of moving averages on the 1-hour chart. So, it differs from the common definition of classic daily moving averages on the daily chart.
Bollinger Bands
There are no entry points now due to extremely low volatility.
Definitions of technical indicators
- Moving average recognizes an ongoing trend through leveling out volatility and market noise. A 50-period moving average is plotted yellow on the chart.
- Moving average identifies an ongoing trend through leveling out volatility and market noise. A 30-period moving average is displayed as the green line.
- MACD indicator represents a relationship between two moving averages that is a ratio of Moving Average Convergence/Divergence. The MACD is calculated by subtracting the 26-period Exponential Moving Average (EMA) from the 12-period EMA. A 9-day EMA of the MACD called the "signal line".
- Bollinger Bands is a momentum indicator. The upper and lower bands are typically 2 standard deviations +/- from a 20-day simple moving average.
- Non-commercial traders - speculators such as retail traders, hedge funds and large institutions who use the futures market for speculative purposes and meet certain requirements.
- Non-commercial long positions represent the total long open position of non-commercial traders.
- Non-commercial short positions represent the total short open position of non-commercial traders.
- The overall non-commercial net position balance is the difference between short and long positions of non-commercial traders.