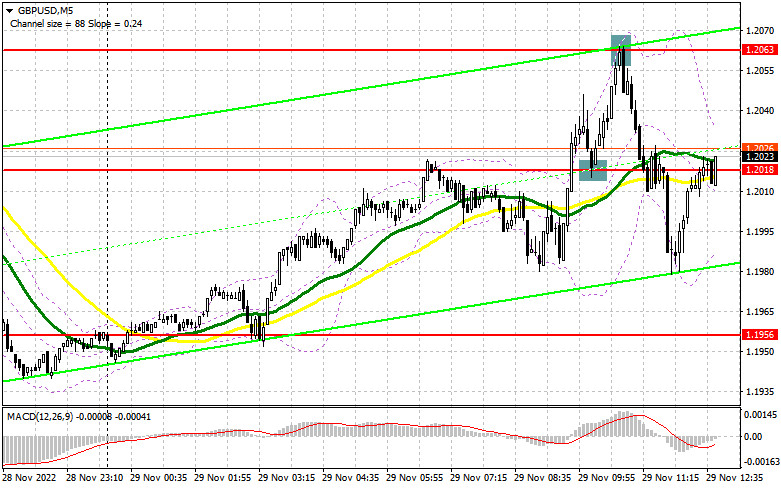
In my previous forecast, I drew your attention to the levels of 1.2018 and 1.2063 and recommended entering the market from them. Let's have a look at the 5-minute chart and analyze the situation there. The pair increased and made a top-down retest of 1.2018. This created a good entry point into long positions. The British pound dashed by 40 pips to the area of 1.2063. Bears managed to take advantage over the market and performed a false breakout at 1.2064. Thus, they received a sell signal and the price dropped by 70 pips. In the second half of the day, the technical picture has been revised.
Long positions on GBP/USD:
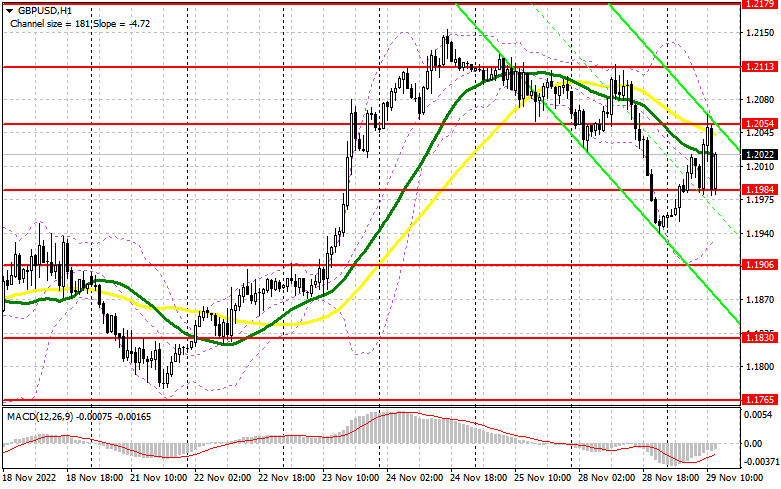
Currently, bulls may only count on weak US data. The US consumer confidence and house price indices are expected to be released today. Weak indicators and a decline in consumer confidence may lead to another pullback to 1.2054. However, if the pair forms a false breakout near 1.1984, this would be a better scenario for opening longs. Such a development may create an excellent entry point, pushing the price to 1.2054. In the afternoon, Governor of the Bank of England Andrew Bailey will give a speech, which should support the British pound. Therefore, a breakthrough and a top-down test of 1.2054 is likely to trigger another surge to 1.2113. The next target would be located at a new monthly high of 1.2179, where traders may lock in profits. If bulls fail to reverse the price near 1.1984, amid strong US statistics, the market is likely to take profits, which may lead to a larger decline in the pair. In this case, it is better to buy the pound only near the support of 1.1906. You may also open long positions on a pullback from 1.1830 or even lower near 1.1765, allowing an intraday correction of 30-35 pips.
Short positions on GBP/USD:
If Andrew Bailey, for some inexplicable reason, changes his stance and says that now it would be better to wait with monetary policy tightening, we may expect the British pound to plummet sharply. Before that, it would be great to see a false breakout near the resistance level of 1.2054. That would give an entry point into short positions with the target at the support level of 1.1984, which was formed earlier today. A breakthrough and a down-top retest of 1.1984 would put bulls under pressure and give a sell signal with the target at the low of 1.1906, where bears are likely to experience some troubles. The next target is located in the area of 1.1830, where traders may take profits. If the price tests this area, it may well ruin bullish prospects at the end of the month. If bears fail to drag the price down from 1.2054, bulls are likely to resume buying the pound. They may push the price to the area of 1.2113. Only a false breakout at this level may give an entry point into short positions. If we see no activity there, it is better to sell the British currency on a rebound from 1.2179, allowing an intraday downward movement of 30-35 pips.

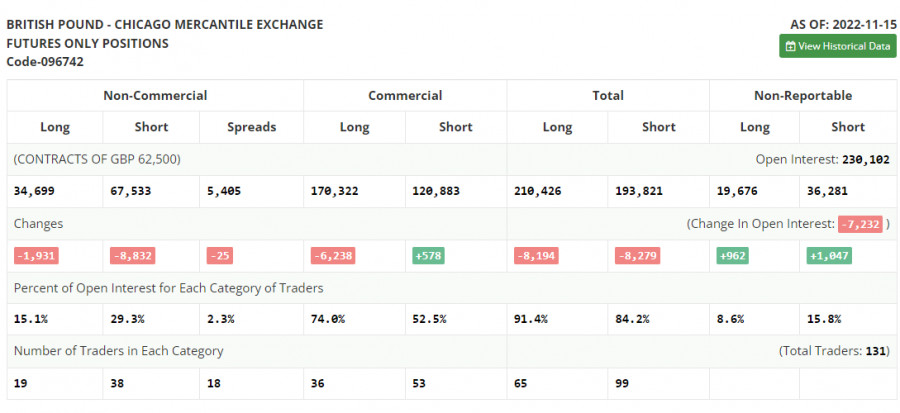
The COT report for November 15 logged a decrease in both short and long positions. The sharp rise in inflation in the UK was quite unexpected, which definitely affected the Bank of England and its future plans for interest rates. The regulator will be forced to pursue an ultra-aggressive policy, which will keep the demand for the pound and allow it to strengthen against the US dollar. On the other hand, the problems in the UK economy will hardly attract big players to the market. The recent data on UK's GDP confirmed this. At the same time, big market players think that the beginning of the long-term cycle of the pound's strengthening is around the corner. Meanwhile, the US Federal Reserve also continues its policy of high-interest rates to curb inflation, which also discourages betting on GBP/USD growth in the medium term. The fresh COT report showed that long non-commercial positions declined by 1,931 to 34,699, while short non-commercial positions declined by 8,832 to 67,533, further lowering the negative non-commercial net position to -32,834 from -39,735 a week earlier. The weekly closing price rose to 1.1885 against 1.1549.

Indicators' signals:
Moving averages
The pair is trading near the 30- and 50-day moving averages, showing that the quotes are moving sideways.
Note: period and prices of moving averages are considered by the author on hourly chart H1 and differ from the common definition of classic daily moving averages on daily chart D1.
Bollinger Bands
If the price declines, the lower boundary of the indicator near 1.1940 will offer support.
Description of indicators
- Moving average defines the current trend by smoothing out volatility and noise. Period 50. Marked in yellow on the chart.
- Moving average defines the current trend by smoothing out volatility and noise. Period 30. Marked in green on the chart.
- MACD (Moving Average Convergence/Divergence) indicator. Fast EMA12. Slow EMA26. SMA9.
- Bollinger Bands. Period 20.
- Non-commercial traders are speculators, such as individual traders, hedge funds, and large institutions, which use the futures market for speculative purposes and meet certain requirements.
- Long non-commercial positions represent the total long open position of non-commercial traders.
- Short non-commercial positions represent the total short open position of non-commercial traders.
- Total non-commercial net position is the difference between short and long positions of non-commercial traders.


