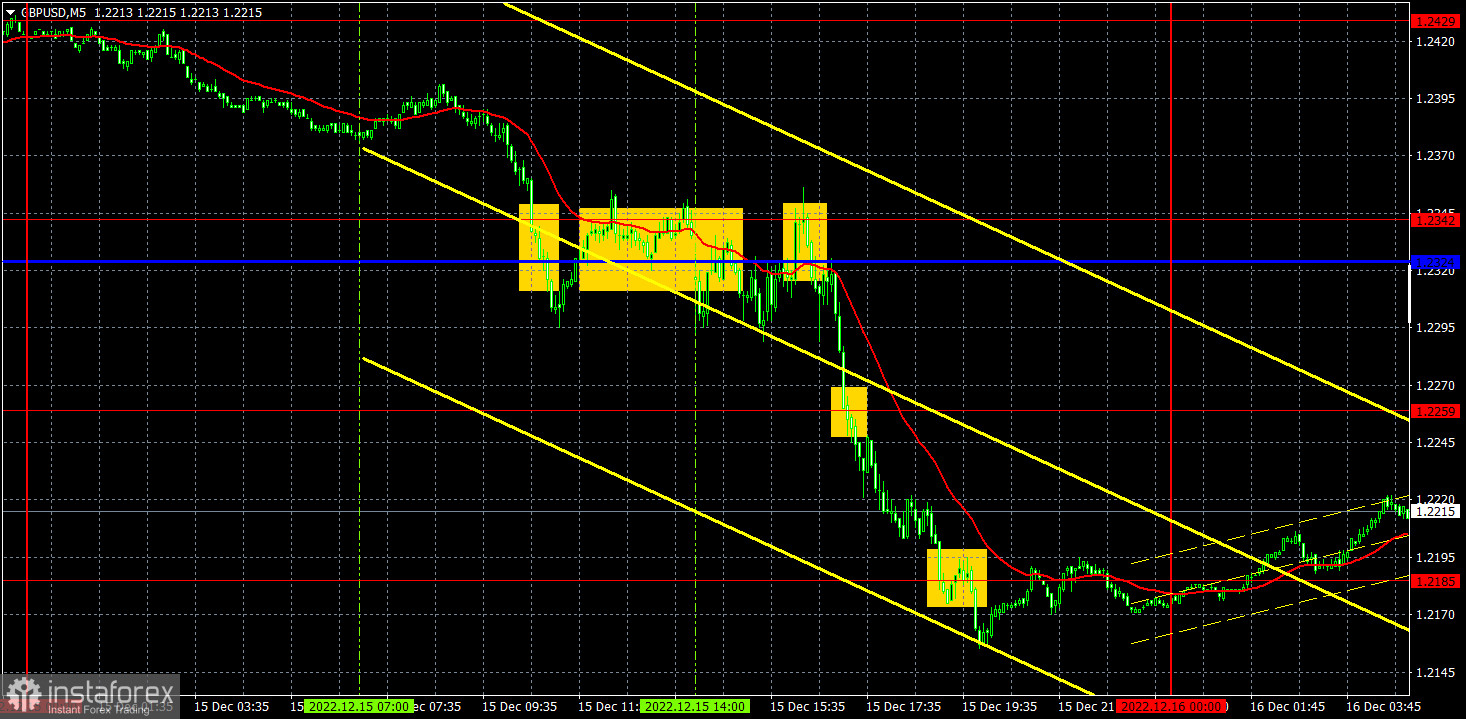
M5 chart of GBP/USD
On Thursday, GBP/USD unexpectedly tumbled by about 250 pips. The fall began at night. The thing is that the outcome of the FOMC meeting was neither hawkish nor dovish. Therefore, late growth in GBP/USD on Wednesday happened for no reason. Basically, the pair had traded higher for about a month before it reversed on Thursday night. Anyway, right after the BoE meeting, the quote extended the bear run. Like the Fed and the ECB, the British regulator raised interest rates by 50 basis points at its final meeting this year. No speech from Governor Bailey followed this time. Apparently, the market is disappointed at the BoE's decision as UK inflation is still high. All in all, the fall in GBP/USD should have happened given all the factors. Besides, there have been signs of an impending technical correction for a long time.
Three trading signals were made yesterday near the range of 1.2324-12342. The first two signals turned out to be false, and the quote failed to go down by 20 pips in both cases. So, traders could have opened and held just one sell trade. Given that the BoE was about to announce its interest rate decision, it was risky to trade in the first place. It was up to traders to decide whether to enter the market or not. Those who chose to open trades could have earned a profit of about 120 pips.
COT report:
The latest COT report showed a decrease in bearish sentiment. In a week, non-commercial traders opened 1,700 long positions and closed 7,800 short positions. The net position grew by about 10,000. This figure has been on the rise for several months. Nevertheless, sentiment remains bearish, and GBP/USD is on the rise for no reason. We assume that the pair may well resume the downtrend soon. Notably, both GBP/USD and EUR/USD now show practically identical movement. However, the net position on EUR/USD is positive and negative on GBP/USD. Non-commercial traders now hold 54,000 sell positions and 30,000 long ones. The gap between them is still wide. As for the total number of open longs and shorts, the bulls have an advantage here by 10,000. Technical factors indicate that the pound may move in an uptrend in the long term. At the same time, fundamental and geopolitical factors signal that the currency is unlikely to strengthen significantly.
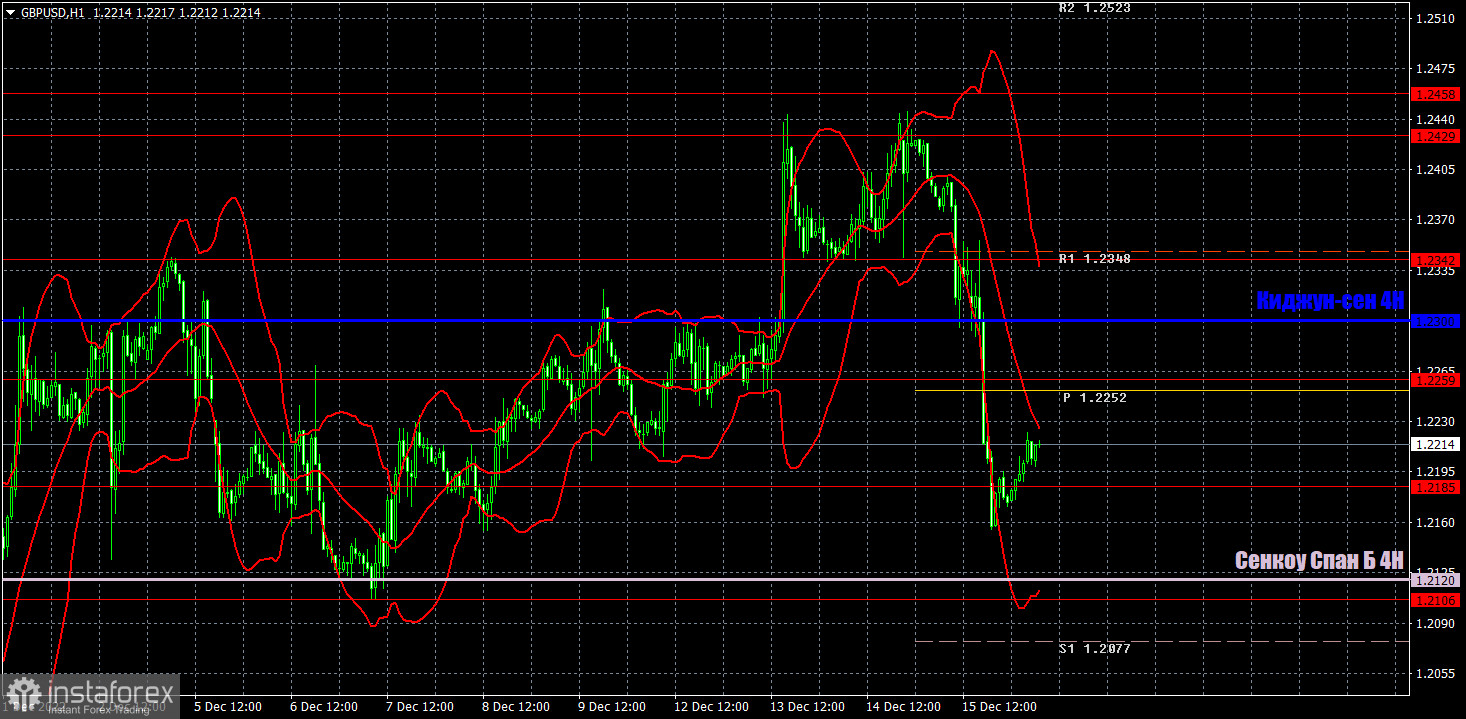
H1 chart of GBP/USD
In the H1 time frame, GBP/USD finally went below the Kijusen line. However, there is another important line on the way down. The Senkou Span B may provide support for the uptrend as the market has been bullish lately. Therefore, any reason may now be used for the uptrend to extend. If the price breaks through the Senkou Span B, a strong correction may occur. On December 16th, important levels are seen at 1.1874, 1.1974-1.2007, 1.2106, 1.2185, 1.2259, 1.2342, 1.2429-1.2458, 1.2120 (Senkou Span B), and 1.2300 (Kijun-sen). Signals are made whenever the price bounces or breaks through these levels and lines. Don't forget to place a stop-loss order at the breakeven point when the price passes 20 pips in the right direction. Ichimoku indicator lines can move during the day, which should be taken into account when determining trading signals. There are also support and resistance although no signals are made near these levels, which can be used for profit-taking. On Friday, business activity data in the services and manufacturing sectors will be delivered in the UK and the US. We also expect high market volatility today.
Indicators on charts:
Resistance/support - thick red lines, near which the trend may stop. They do not make trading signals.
The Kijun-sen and Senkou Span B lines are the Ichimoku indicator lines moved to the hourly timeframe from the 4-hour timeframe. They are also strong lines.
Extreme levels are thin red lines, from which the price used to bounce earlier. They can produce trading signals.
Yellow lines are trend lines, trend channels, and any other technical patterns.
Indicator 1 on the COT chart is the size of the net position of each trader category.
Indicator 2 on the COT chart is the size of the net position for the Non-commercial group of traders.