empty
30.12.2022 07:43 AM
Outlook and trading signals for GBP/USD on December 30. COT report. Analysis of market situation. The pound is ending the year in a flat.

M5 chart of GBP/USD

This image is no longer relevant

GBP/USD traded between 1.2007 and 1.2106 on Thursday. So while the euro is trying to go back to moving up, the pound is completing its downward movement and going into a flat. The fact that both major currency pairs are moving in completely different directions right now is a bit surprising since there are no fundamental and macroeconomic backdrops at the moment. Nevertheless, this is the holiday period, so illogical and non-standard movements shouldn't be surprising. Today is the last trading day of 2022. Hardly anyone is expecting either strong movements or a trend from the pair. I believe that the pound has not yet fully corrected, so the bearish movement will continue in January 2023.

All of Thursday's trading signals were near the critical line. At the beginning of the US session, the pair rebounded from the Kijun-Sen line and fell 38 pips within 15 minutes. Not much, but it was significant. Of course, this trading signal cannot be considered a real one since GBP did not reach the nearest target level. However, it did pass the 20 points that was required to place the Stop Loss to Breakeven. Then the pair returned to the critical line, but it could neither rebound from it nor cross it, which is why there was no signal.

COT report

This image is no longer relevant

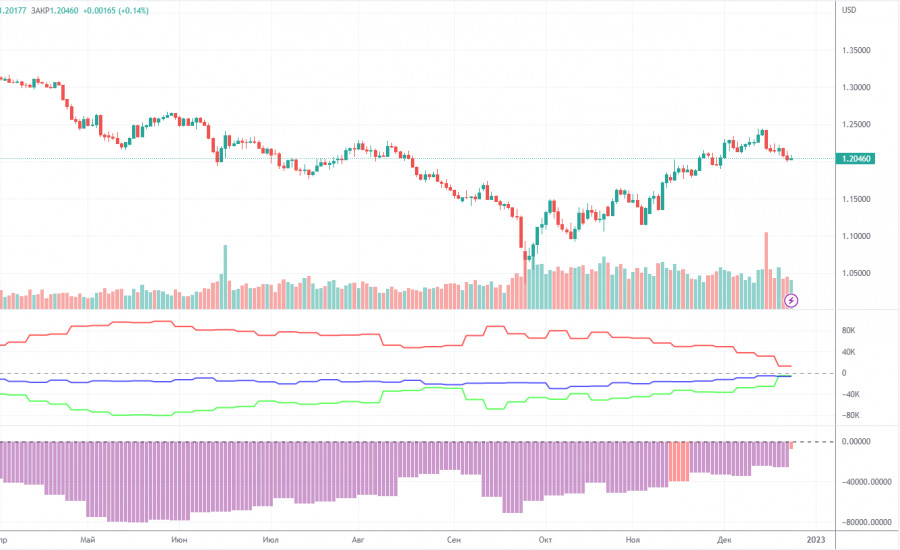
The latest COT report showed a decrease in bearish sentiment. During the given period, non-commercial traders opened 3,200 long positions and closed as many as 16,800 short positions. Thus, the net position grew by about 20,000, which is a lot for the pound. This figure has been on the rise for several months. Nevertheless, sentiment remains bearish, and GBP/USD is on the rise for no reason. I assume that the pair may well resume the downtrend soon since there is a need for at least a correction. Notably, both GBP/USD and EUR/USD now show practically identical movement. Since the net position is not even bullish yet, buying may continue for a few months to come. Non-commercial traders now hold 40,800,000 short positions and 35,200 long ones. The gap between them is small. I am still skeptical about the pound's long term growth, though there are technical reasons for it. At the same time, fundamental and geopolitical factors signal that the currency is unlikely to strengthen significantly.

H1 chart of GBP/USD

This image is no longer relevant

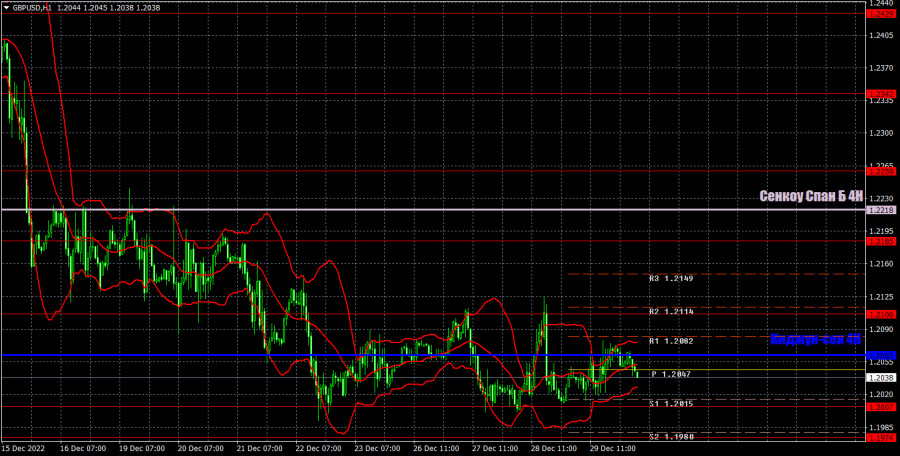
On the one-hour chart, GBP/USD maintains the bearish sentiment but is also in the horizontal channel. If this movement persists, the lines of the Ichimoku indicator may lose their strength in a short time, and we'll have to fix their last acceptable price value, because the pair can cross them 5 times a day in a flat. On December 30, the pair may trade at the following levels: 1.1760, 1.1874, 1.1974-1.2007, 1.2106, 1.2185, 1.2259. Senkou Span B (1.2218) and Kijun Sen (1.2063) lines may also generate signals. Pullbacks and breakouts through these lines may produce signals as well. A Stop Loss order should be set at the breakeven point after the price passes 20 pips in the right direction. Ichimoku indicator lines may move during the day, which should be taken into account when determining trading signals. In addition, the chart does illustrate support and resistance levels, which could be used to lock in profits. There are no important events in the UK and the US, so there will be nothing to react to for today. I believe that the flat may last till the end of the year, or even longer.

What we see on the trading charts:

Price levels of support and resistance are thick red lines, near which the movement may end. They do not provide trading signals.

The Kijun-sen and Senkou Span B lines are the lines of the Ichimoku indicator, moved to the one-hour chart from the 4-hour one. They are strong lines.

Extreme levels are thin red lines from which the price bounced earlier. They provide trading signals.

Yellow lines are trend lines, trend channels, and any other technical patterns.

Indicator 1 on the COT charts reflects the net position size of each category of traders.

Indicator 2 on the COT charts reflects the net position size for the non-commercial group.

Paolo Greco,
ผู้เชี่ยวชาญด้านการวิเคราะห์ของ InstaForex
© 2007-2025
เลือกช่วงเวลา
5
นาที
15
นาที
30
นาที
1
ชั่วโมง
4
ชั่วโมง
1
วัน
1
สัปดาห์
รับผลกำไรจากการเปลี่ยนแปลงอัตราสกุลเงินดิจิทัลกับ InstaForex.
ดาวน์โหลด MetaTrader 4 และเปิดการซื้อขายครั้งแรกของคุณ.
  • Grand Choice
    Contest by
    InstaForex
    InstaForex always strives to help you
    fulfill your biggest dreams.
    เข้าร่วมการแข่งขัน


บทความแนะนำ

GBP/USD: แผนการเทรดสำหรับช่วงตลาดสหรัฐวันที่ 28 มีนาคม (รีวิวการเทรดช่วงเช้า)

ในการพยากรณ์ช่วงเช้าของฉัน ฉันได้มุ่งเน้นไปที่ระดับ 1.2964 และวางแผนที่จะตัดสินใจเข้าสู่ตลาดตามระดับนี้ มาดูกราฟ 5 นาทีและวิเคราะห์สิ่งที่เกิดขึ้น การเพิ่มขึ้นและการทะลุผ่านเท็จรอบๆ 1.2964 ทำให้เกิดสัญญาณขายสำหรับปอนด์ ซึ่งส่งผลให้เกิดการลดลงไปยังระดับสนับสนุนในตอนเช้าที่ 1.2940 จากที่ฉันเคยซื้อ GBP/USD ในช่วงเริ่มต้นของเซสชั่นยุโรป

Miroslaw Bawulski 18:54 2025-03-28 UTC+2

EUR/USD: แผนการซื้อขายสำหรับช่วงการซื้อขายในสหรัฐอเมริกาวันที่ 28 มีนาคม (การวิเคราะห์การซื้อขายตอนเช้า)

ในคาดการณ์ช่วงเช้าของฉัน ฉันได้เน้นไปที่ระดับ 1.0801 และวางแผนที่จะใช้เป็นฐานในการเข้าตลาด ลองมาดูกราฟ 5 นาทีเพื่อดูว่าเกิดอะไรขึ้น การเพิ่มขึ้นและการเบรกหลอกที่ระดับ 1.0801 ทำให้มีโอกาสในการเปิดตำแหน่งขายระยะสั้น ซึ่งส่งผลให้คู่สกุลเงินตกลงไปมากกว่า 35 จุดถึงระดับเป้าหมายที่ 1.0764 ภาพทางเทคนิคไม่ได้รับการปรับปรุงใหม่ในครึ่งหลังของวัน

Miroslaw Bawulski 18:52 2025-03-28 UTC+2

วิธีการเทรดคู่สกุลเงิน GBP/USD ในวันที่ 28 มีนาคม? เคล็ดลับง่ายๆ และการวิเคราะห์การเทรดสำหรับผู้เริ่มต้น

เมื่อวันพฤหัสบดี คู่สกุลเงิน GBP/USD ก็มีการซื้อขายสูงขึ้นอีกแล้ว—และค่อนข้างแข็งแกร่ง แม้จะมีการเผยแพร่รายงาน GDP ไตรมาสที่ 4 ที่มั่นคงในสหรัฐอเมริกา แต่มันไม่ได้ทำให้ความกดดันต่อตลาดเงินดอลลาร์ลดลงเลย เหตุผลเนื่องจากเมื่อค่ำคืนก่อนหน้า Donald Trump ได้ประกาศภาษีนำเข้าใหม่สำหรับทุกประเทศที่ส่งออกรถยนต์มายังสหรัฐอเมริกา เป็นผลให้เงินปอนด์ยังไม่เริ่มการลดลงที่คาดหวังไว้

Paolo Greco 06:05 2025-03-28 UTC+2

วิธีการเทรดคู่สกุลเงิน EUR/USD ในวันที่ 28 มีนาคม เคล็ดลับง่ายๆ และการวิเคราะห์การเทรดสำหรับผู้เริ่มต้น

คู่สกุลเงิน EUR/USD เพิ่มขึ้นถึงระดับ 1.0804 เมื่อวันพฤหัสบดี การเพิ่มขึ้นของค่าเงินยูโร (หรือที่จริงแล้ว เป็นการลดลงของดอลล่าร์) อย่างฉับพลันและค่อนข้างแข็งแรงนี้มีเพียงหนึ่งคนที่จะทำให้เกิดขึ้นได้—โดนัลด์ ทรัมป์ ช่วงกลางคืนที่ผ่านมานี้เขาได้ประกาศภาษีใหม่กับการนำเข้าไปยังสหรัฐฯ โดยครั้งนี้เล็งเป้าหมายไปยังรถยนต์ที่ผลิตในต่างประเทศทั้งหมด Elon Musk ต่างเฉลิมฉลอง

Paolo Greco 06:05 2025-03-28 UTC+2

คำแนะนำและการวิเคราะห์การซื้อขายสำหรับ GBP/USD วันที่ 28 มีนาคม: ปอนด์ยังคงแกว่งตัว

คู่สกุลเงิน GBP/USD แสดงการเคลื่อนไหวขึ้นในวันพฤหัสบดีอย่างเต็มที่ แน่นอนว่าปัจจัยเร่งให้เกิดการเปลี่ยนแปลงนี้คือ Donald Trump อีกครั้ง โดยเขาได้กำหนดภาษี 25% ใหม่สำหรับสินค้านำเข้ารถยนต์ทั้งหมดเข้าสู่สหรัฐฯ ไม่ต้องพูดถึงเลยว่าตลาดได้โละดอลลาร์ออกไปเหมือนเป็นฝันร้าย ไม่แม้กระทั่งรายงาน GDP ของสหรัฐฯ ที่แสดงการเติบโตในไตรมาสสี่ที่

Paolo Greco 02:47 2025-03-28 UTC+2

คำแนะนำและการวิเคราะห์การเทรดสำหรับ EUR/USD ณ วันที่ 28 มีนาคม: ภาษีศุลกากรของ Trump และ GDP

ในวันพฤหัสบดี คู่สกุลเงิน EUR/USD ทะยานขึ้นอย่างรวดเร็วโดยไม่ทำลายแนวโน้มขาลงที่มีอยู่อย่างต่อเนื่องในช่วงวันที่ผ่านมา เหตุผลที่ชัดเจนคือค่าเงินดอลลาร์ลดลงหลังจากที่ Donald Trump ประกาศภาษีใหม่ต่อทุกประเทศที่ส่งออกรถยนต์ไปยังสหรัฐฯ ดังที่คาดไว้ ตลาดตอบสนองด้วยการขายดอลลาร์อีกครั้ง ครั้งนี้ค่าเงินดอลลาร์สหรัฐไม่ได้ละลาย ซึ่งบ่งบอกถึงความก้าวหน้า อย่างไรก็ตาม ประธานาธิบดีสหรัฐฯ ได้สร้างปัญหาให้กับดอลลาร์อีกครั้ง

Paolo Greco 02:47 2025-03-28 UTC+2

GBP/USD: แผนการซื้อขายสำหรับเซสชันอเมริกันวันที่ 27 มีนาคม (รีวิวการซื้อขายเช้า)

ในการพยากรณ์ช่วงเช้าของฉัน ฉันได้เล็งโฟกัสไปที่ระดับ 1.2916 และวางแผนที่จะตัดสินใจซื้อขายตามระดับนี้ มาดูกราฟ 5 นาทีและดูว่าเกิดอะไรขึ้น การเบรคเอาท์และทดสอบระดับ 1.2916 ซ้ำกันได้ทำให้เกิดจุดเข้าสำหรับการซื้อเงินปอนด์ แต่คู่เงินนี้ขึ้นเพียง 10 จุดเท่านั้น และฉันไม่ได้จับจังหวะขึ้นที่เหมาะสมได้ มุมมองทางเทคนิคถูกปรับใหม่สำหรับครึ่งหลังของวัน

Miroslaw Bawulski 17:56 2025-03-27 UTC+2

EUR/USD: แผนการเทรดสำหรับเซสชั่นสหรัฐฯ วันที่ 27 มีนาคม (รีวิวการเทรดช่วงเช้า)

ในบทวิเคราะห์เช้าของฉัน ฉันเน้นไปที่ระดับ 1.0769 และมีแผนจะตัดสินใจซื้อขายตามระดับนี้ มาดูกราฟ 5 นาทีและดูว่าเกิดอะไรขึ้น คู่สกุลเงินลดลงและเกิดการทะลุที่ผิดพลาดรอบๆ ระดับ 1.0769 ซึ่งอนุญาตให้เข้าซื้อในตำแหน่งยาวได้ แต่ไม่มีการเคลื่อนไหวขึ้นที่สำคัญรูปแบบทางเทคนิคในครึ่งหลังของวันยังคงไม่เปลี่ยนแปลง เนื่องจากความพยายามในการกดดันขายยูโรทั้งหมดล้มเหลว จึงมีความเป็นไปได้ที่คู่สกุลนี้จะฟื้นตัวในครึ่งหลังของวัน —

Miroslaw Bawulski 17:53 2025-03-27 UTC+2

วิธีการเทรดคู่เงิน GBP/USD ในวันที่ 27 มีนาคม? เคล็ดลับง่ายๆ และการวิเคราะห์การเทรดสำหรับมือใหม่

ในวันพุธ คู่เงิน GBP/USD ได้แสดงการเคลื่อนไหวลง ซึ่งในที่สุดก็สอดคล้องกับสถานการณ์ทางเศรษฐกิจมหภาค ในระหว่างวัน นักลงทุนสนใจรายงานสองฉบับ ในสหราชอาณาจักรได้มีการเผยแพร่รายงานเงินเฟ้อ ขณะที่ในสหรัฐฯ เป็นรายงานคำสั่งซื้อสินค้าคงทน เงินเฟ้อของสหราชอาณาจักรในเดือนกุมภาพันธ์ต่ำกว่าที่คาดการณ์ไว้ และถึงแม้ว่าสิ่งนี้จะไม่มีผลมากนัก (เงินเฟ้อยังคงสูงเกินไป และ Andrew

Paolo Greco 05:42 2025-03-27 UTC+2

วิธีเทรดคู่สกุลเงิน EUR/USD ในวันที่ 27 มีนาคม? เคล็ดลับง่ายๆ และการวิเคราะห์การเทรดสำหรับผู้เริ่มต้น

ในวันพุธ คู่สกุลเงิน EUR/USD ยังคงลดลงอย่างช้า ๆ การลดค่าเงินยูโรนั้นดูค่อนข้างสมเหตุสมผล แม้ว่าผู้ค้าจะยังคงเพิกเฉยต่อเหตุการณ์เศรษฐกิจมหภาคส่วนใหญ่ก็ตาม ในขณะนี้ ตลาดกำลังซื้อขายตามกฎของตัวเอง บางครั้งทิศทางการเคลื่อนไหวก็สอดคล้องกับลักษณะของข้อมูลเศรษฐกิจมหภาค—บางครั้งก็ไม่ เมื่อวานนี้ เช่น รายงานคำสั่งซื้อสินค้าคงทนในสหรัฐฯ ก็ออกมาดีกว่าที่คาดไว้มาก และผลให้ดอลลาร์สหรัฐเพิ่มขึ้น

Paolo Greco 05:42 2025-03-27 UTC+2
หากไม่สะดวกคุยในตอนนี้
ระบุคำถามไว้ได้ใน แชท.
Widget callback
 

Dear visitor,

Your IP address shows that you are currently located in the USA. If you are a resident of the United States, you are prohibited from using the services of InstaFintech Group including online trading, online transfers, deposit/withdrawal of funds, etc.

If you think you are seeing this message by mistake and your location is not the US, kindly proceed to the website. Otherwise, you must leave the website in order to comply with government restrictions.

Why does your IP address show your location as the USA?

  • - you are using a VPN provided by a hosting company based in the United States;
  • - your IP does not have proper WHOIS records;
  • - an error occurred in the WHOIS geolocation database.

Please confirm whether you are a US resident or not by clicking the relevant button below. If you choose the wrong option, being a US resident, you will not be able to open an account with InstaForex anyway.

We are sorry for any inconvenience caused by this message.