empty
05.01.2023 07:48 AM
Outlook and trading signals for EUR/USD on January 5. COT report. Analysis of market situation. The flat is back in the market.

M5 chart of EUR/USD

This image is no longer relevant

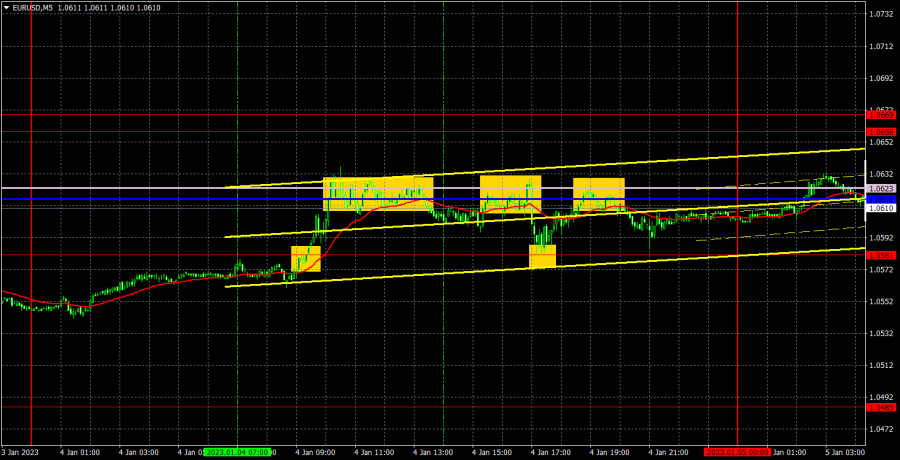
EUR/USD quickly returned to the 1.0581-1.0658 horizontal channel on Thursday and it moved exclusively sideways for most of the day. I certainly don't think that the flat will resume now, though we cannot totally rule it out. Anyway, important macro data are coming out now, the holidays are coming to an end, representatives of central banks will soon come back to work and they will soon deliver their speeches. However, after the quotes closed below the horizontal channel on Tuesday the downward movement did not continue, which is important. On the one hand, it might mean a pullback to the upside, after which the fall will resume. On the other hand, there were no reasons for the euro to fall on Tuesday, so the market may just admit its mistake and continue moving in the flat. Tomorrow's EU and US macro data is against the second option, as it is hard to imagine that the inflation and non-farms reports will be ignored by the market.

All of Wednesday's trading signals were formed in the 1.0581-1.0623 area. That is, in the 40-point range, where the Senkou Span B and Kijun Sen lines ran. Therefore, each time a signal was formed, the price was almost immediately near the next important line or level. Theoretically, it was possible to "add" some ten points of profit, but we leave these decisions to traders, because not everybody likes to trade in the absolute flat. In any case, almost all of the trading signals were not false.

COT report
This image is no longer relevant

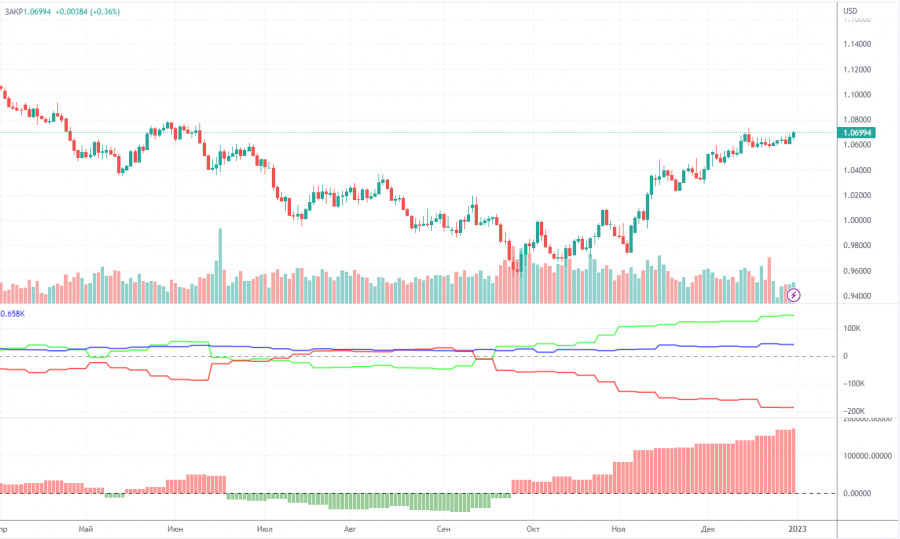
The COT reports for the euro in the last few months have been fully consistent with what is happening in the market. You can clearly see on the chart that the net position of big players (the second indicator) has been growing since early September. Around the same time, the euro started to grow. At this time, the net position of the non-commercial traders has been bullish and strengthens almost every week, but it is a rather high value that allows us to assume that the upward movement will end soon. Notably, the green and red lines of the first indicator have moved far apart from each other, which often means the end of the trend. During the given period, non-commercial traders opened 2,700 long positions, whereas the number of short positions fell by 1,100. Thus, the net positions rose by 3,800. The number of long positions is 146,000 higher than the number of short positions opened by non-commercial traders. So the question now is how long will the big players increase their longs? Moreover, from a technical perspective, a bearish correction should have started a long time ago. In my opinion, this process can not continue for another 2 or 3 months. Even the net position indicator shows that we need to "unload" a bit, that is, to correct. The overall number of short orders exceeds the number of long orders by 41,000 (685,000 vs. 644,000).

H1 chart of EUR/USD
This image is no longer relevant

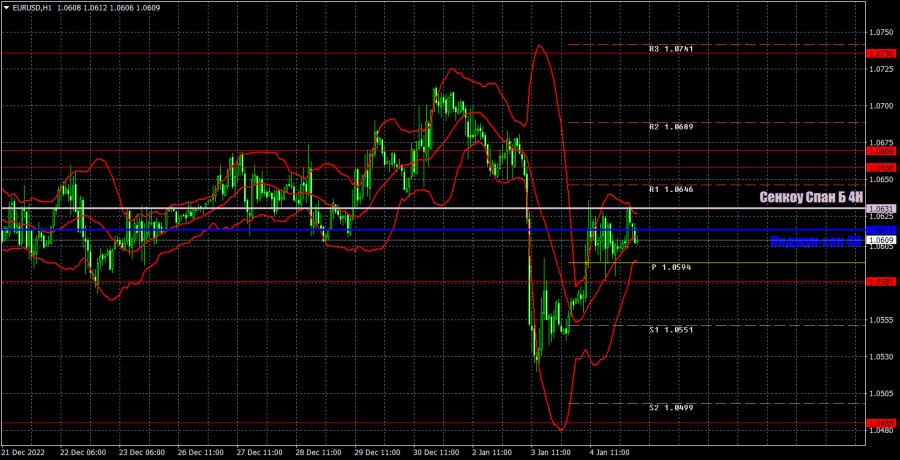
On the one-hour chart, EUR/USD clearly returned to the lines of the Ichimoku indicator, so now it is the moment of truth. If the price clearly bounces from these lines, the downward movement will resume. If not, the flat may resume. After Friday the pair could go anywhere because the macroeconomic background will be very strong on that day. On Thursday, the pair may trade at the following levels: 1.0269, 1.0340-1.0366, 1.0485, 1.0581, 1.0658-1.0669, and also Senkou Span B lines (1.0631) and Kijun Sen (1.0616). Lines of the Ichimoku indicator may move during the day, which should be taken into account when determining trading signals. There are also support and resistance levels, but signals are not formed near these levels. Bounces and breakouts of the extreme levels and lines could act as signals. Don't forget about stop-loss orders, if the price covers 15 pips in the right direction. This will prevent you from losses in case of a false signal. On January 5, the U.S. will release the ADP private sector report, unemployment claims and the second estimate of the service sector business activity index for December. All three reports are considered to be of little importance, so I don't expect the market to react to them.

What we see on the trading charts:

Price levels of support and resistance are thick red lines, near which the movement may end. They do not provide trading signals.

The Kijun-sen and Senkou Span B lines are the lines of the Ichimoku indicator, moved to the one-hour chart from the 4-hour one. They are strong lines.

Extreme levels are thin red lines from which the price bounced earlier. They provide trading signals.

Yellow lines are trend lines, trend channels, and any other technical patterns.

Indicator 1 on the COT charts reflects the net position size of each category of traders.

Indicator 2 on the COT charts reflects the net position size for the non-commercial group.

Paolo Greco,
ผู้เชี่ยวชาญด้านการวิเคราะห์ของ InstaForex
© 2007-2025
เลือกช่วงเวลา
5
นาที
15
นาที
30
นาที
1
ชั่วโมง
4
ชั่วโมง
1
วัน
1
สัปดาห์
รับผลกำไรจากการเปลี่ยนแปลงอัตราสกุลเงินดิจิทัลกับ InstaForex.
ดาวน์โหลด MetaTrader 4 และเปิดการซื้อขายครั้งแรกของคุณ.
  • Grand Choice
    Contest by
    InstaForex
    InstaForex always strives to help you
    fulfill your biggest dreams.
    เข้าร่วมการแข่งขัน


บทความแนะนำ

GBP/USD: แผนการเทรดสำหรับช่วงเวลาในสหรัฐฯ วันที่ 2 เมษายน (ทบทวนการซื้อขายในช่วงเช้า)

ในการคาดการณ์ช่วงเช้าของฉัน ฉันได้เน้นระดับที่ 1.2903 ไว้ และวางแผนที่จะตัดสินใจซื้อขายตามระดับนั้น ลองดูที่กราฟ 5 นาทีและวิเคราะห์ว่าเกิดอะไรขึ้น การลดลงตามมาด้วยการเบรกเอาท์ที่ผิดพลาดในระดับนั้น ซึ่งให้จุดเข้าซื้อสำหรับการซื้อเงินปอนด์ นำไปสู่การขึ้นของคู่สกุลเงินมากกว่า 40 จุด มุมมองทางเทคนิคได้รับการปรับแก้สำหรับช่วงครึ่งหลังของวัน การเปิดตำแหน่งซื้อระยะยาวในคู่

Miroslaw Bawulski 20:07 2025-04-02 UTC+2

EUR/USD: แผนการซื้อขายสำหรับช่วงตลาดสหรัฐในวันที่ 2 เมษายน (การตรวจสอบการซื้อขายช่วงเช้า)

ในคำทำนายเช้าวันนี้ ฉันได้เน้นที่ระดับ 1.0781 และวางแผนการตัดสินใจซื้อขายโดยอิงจากระดับนี้ มาดูกราฟ 5 นาทีและวิเคราะห์เหตุการณ์ที่เกิดขึ้น การลดลงและการเกิด false breakout ในระดับนั้นทำให้มีจุดเข้าที่ดีสำหรับการเปิดตำแหน่งซื้อ ซึ่งส่งผลให้ค่าเงินยูโรเพิ่มขึ้น 30 จุด ภาพทางเทคนิคยังไม่ได้รับการปรับปรุงสำหรับช่วงบ่าย

Miroslaw Bawulski 20:04 2025-04-02 UTC+2

วิธีการซื้อขายคู่สกุลเงิน GBP/USD ในวันที่ 2 เมษายน? เคล็ดลับง่ายๆ และการวิเคราะห์การซื้อขายสำหรับผู้เริ่มต้น

ในวันอังคาร คู่เงิน GBP/USD ยังคงซื้อขายอยู่ในกรอบแนวราบ เช่นเดียวกับในหลายสัปดาห์ที่ผ่านมา ปัจจัยเศรษฐกิจมหภาคของสหราชอาณาจักรและสหรัฐอเมริกาแทบไม่มีผลต่อการเคลื่อนไหวระหว่างวันของคู่เงินนี้ ความผันผวนยังคงต่ำมาก และราคายังไม่ได้ทดสอบขอบเขตของช่องแนวราบนี้ ดังที่เราเตือนไว้เมื่อต้นสัปดาห์ ปัจจัยพื้นฐานหรือเศรษฐกิจมหภาคที่แข็งแกร่งไม่สามารถรับประกันการสิ้นสุดของช่วงกรอบแนวราบหรือการเกิดขึ้นของแนวโน้มที่ชัดเจน ตัวอย่างเช่น เมื่อวานนี้ PMI ภาคการผลิตของสหราชอาณาจักรออกมาที่อ่อนแอ เช่นเดียวกับดัชนี

Paolo Greco 06:25 2025-04-02 UTC+2

วิธีการซื้อขายคู่สกุลเงิน EUR/USD ในวันที่ 2 เมษายน? เคล็ดลับง่ายๆ และการวิเคราะห์การซื้อขายสำหรับผู้เริ่มต้น

ในวันอังคาร คู่สกุลเงิน EUR/USD ยังคงซื้อขายในรูปแบบเดิมเช่นสัปดาห์ก่อน หมายความว่าอย่างไร? การเคลื่อนไหวของราคาที่ค่อนข้างอ่อนแอ การถอยหลังและแก้ไขบ่อยครั้ง ไม่มีทิศทางชัดเจนในระหว่างวัน และความสับสนโดยรวม เราต้องการเตือนผู้ค้ารายใหม่ว่าการเคลื่อนไหวของราคาตลาดสามารถแตกต่างกันมาก สัญญาณการซื้อขายก็สามารถหลากหลายได้เช่นกัน งานอันดับหนึ่งสำหรับผู้ค้าคือการซื้อขายในเวลาที่เหมาะสมสำหรับพวกเขาและระบบซื้อขายของพวกเขา ไม่น่าแปลกใจที่ระบบการซื้อขายอาจเป็นระบบติดตามเทรนด์หรือระบบในกรอบ ระบบติดตามเทรนด์จะไม่ทำงานในตลาดที่เคลื่อนไหวในกรอบ ดังนั้น

Paolo Greco 06:25 2025-04-02 UTC+2

คำแนะนำและการวิเคราะห์การเทรดสำหรับ GBP/USD ในวันที่ 2 เมษายน: ตลาดยังคงพักผ่อน

คู่สกุลเงิน GBP/USD ยังคงซื้อขายในรูปแบบเดียวกันในวันอังคารเช่นเดียวกับในช่วงหลายสัปดาห์ที่ผ่านมา การเคลื่อนไหวของราคาทั้งหมดเกิดขึ้นในช่วงระหว่าง 1.2863 ถึง 1.2981 ในช่วงสองสัปดาห์ที่ผ่านมา เส้นชี้วัด Ichimoku ถูกละเลยในช่วงนี้ สถานการณ์เศรษฐกิจมหภาคไม่มีผลเพราะราคายังคงเคลื่อนไหวในแนวทางเที่ยงตรง สถานการณ์ทางเทคนิคปัจจุบันสำหรับเงินปอนด์มีความเอื้อเฟื้อต่อผู้ค้าสูงมาก แน่นอนว่าตลาดตอบสนองต่อรายงานรายบุคคล แต่การเคลื่อนไหวดังกล่าวแทบไม่มีความหมายสำหรับการเทรด

Paolo Greco 04:00 2025-04-02 UTC+2

คำแนะนำและการวิเคราะห์การซื้อขายสำหรับ EUR/USD ณ วันที่ 2 เมษายน: วันจันทร์ค่อยๆ เลื่อนไปสู่วันอังคาร

คู่สกุลเงิน EUR/USD ที่ซื้อขายในวันอังคารมีรูปแบบเหมือนกับวันจันทร์ เราได้กล่าวเตือนเมื่อวานนี้ว่าแม้ว่าจะมีเหตุการณ์ด้านเศรษฐกิจมหภาคมากมาย แต่ก็อาจจะไม่ส่งผลต่อความรู้สึกของตลาดหรือการเคลื่อนไหวของคู่เงินนี้ รายงานมีความสำคัญแต่ก็ไม่ได้ทำให้ผู้เข้าร่วมตลาดมีความต้องการเพิ่มขึ้นในการค้าขายมากขึ้น แน่นอนว่าเราควรให้ความสำคัญกับรายงานอัตราเงินเฟ้อของยูโรโซน ซึ่งลดลงเป็น 2.2% YoY ในเดือนมีนาคม ต่ำกว่าที่เศรษฐกรคาดการณ์ไว้ อัตราเงินเฟ้อพื้นฐานก็ลดลงเป็น 2.4% เช่นกัน

Paolo Greco 04:00 2025-04-02 UTC+2

GBP/USD: แผนการซื้อขายสำหรับตลาดในสหรัฐฯ วันที่ 1 เมษายน (ทบทวนการซื้อขายในช่วงเช้า)

ในพยากรณ์ช่วงเช้าของฉัน ฉันได้เน้นถึงระดับที่ 1.2916 และวางแผนที่จะตัดสินใจเข้าตลาดตามระดับนี้ ลองมาดูที่แผนภูมิ 5 นาทีและวิเคราะห์สิ่งที่เกิดขึ้น การลดลงและการเกิด false breakout ที่ระดับนั้นนำไปสู่โอกาสในการซื้อปอนด์ แต่หลังจากเพิ่มขึ้น 10 จุด ความต้องการได้ลดลงอย่างรวดเร็ว

Miroslaw Bawulski 19:49 2025-04-01 UTC+2

EUR/USD: แผนการซื้อขายสำหรับช่วงการซื้อขายในสหรัฐวันที่ 1 เมษายน (บทวิจารณ์การซื้อขายช่วงเช้า)

ในคำทำนายช่วงเช้าของฉัน, ฉันได้เน้นถึงระดับที่ 1.0815 และวางแผนที่จะตัดสินใจเข้าตลาดตามระดับนั้น ลองมาดูกราฟ 5 นาทีแล้ววิเคราะห์ว่าเกิดอะไรขึ้น มีการปรับลงเกิดขึ้นจริงแต่ไม่มีการเกิดสัญญาณหลอก ดังนั้นจึงไม่ได้รับการยืนยันจุดเข้า ต้องปรับแนวโน้มทางเทคนิคสำหรับครึ่งหลังของวัน เพื่อเปิดสถานะซื้อใน EUR/USD: ข้อมูลที่ไม่ค่อยดีนักในกิจกรรมการผลิตในกลุ่มประเทศยูโรโซนไม่ได้ช่วยสนับสนุนค่าเงินยูโรในช่วงครึ่งแรกของวัน ในช่วงครึ่งหลังก็จะมีการประกาศข้อมูลในลักษณะเดียวกันจากสหรัฐฯ รวมถึง

Miroslaw Bawulski 19:31 2025-04-01 UTC+2

GBP/USD: แผนการเทรดสำหรับช่วงตลาดสหรัฐในวันที่ 31 มีนาคม (วิเคราะห์การเทรดในช่วงเช้า)

ในคำทำนายตอนเช้าของฉัน ฉันได้มุ่งเน้นไปที่ระดับ 1.2966 และวางแผนการตัดสินใจในการซื้อขายโดยอิงจากระดับนี้ ลองดูแผนภูมิ 5 นาทีและวิเคราะห์ว่าเกิดอะไรขึ้น มีการเพิ่มขึ้นตามด้วยการทะลุออกปลอมใกล้ระดับ 1.2966 ซึ่งให้โอกาสขายสำหรับเงินปอนด์ ทำให้ราคาลดลงไปยังแนวรับตอนเช้าที่ 1.2945 การทะลุและการทดสอบระดับนี้อีกครั้งให้สัญญาณอีกครั้งในการขาย ทำให้คู่สกุลเงินลดลงไปที่ 1.2922

Miroslaw Bawulski 19:52 2025-03-31 UTC+2

EUR/USD: แผนการเทรดสำหรับช่วงเซสชันสหรัฐอเมริกาในวันที่ 31 มีนาคม (วิเคราะห์การซื้อขายในช่วงเช้า)

ในการพยากรณ์เช้านี้ ฉันได้ระบุระดับ 1.0829 ไว้และวางแผนที่จะตัดสินใจการซื้อขายบนฐานตัวเลขดังกล่าว มาดูกราฟ 5 นาทีเพื่อดูว่าเกิดอะไรขึ้น การลดลงตามมาด้วยการทะลุขึ้นผิดพลาดรอบ ๆ ระดับ 1.0829 ซึ่งให้จุดเริ่มต้นสำหรับตำแหน่งซื้อ ส่งผลให้คู่เงินขึ้นไป 20 จุด

Miroslaw Bawulski 19:50 2025-03-31 UTC+2
หากไม่สะดวกคุยในตอนนี้
ระบุคำถามไว้ได้ใน แชท.
Widget callback
 

Dear visitor,

Your IP address shows that you are currently located in the USA. If you are a resident of the United States, you are prohibited from using the services of InstaFintech Group including online trading, online transfers, deposit/withdrawal of funds, etc.

If you think you are seeing this message by mistake and your location is not the US, kindly proceed to the website. Otherwise, you must leave the website in order to comply with government restrictions.

Why does your IP address show your location as the USA?

  • - you are using a VPN provided by a hosting company based in the United States;
  • - your IP does not have proper WHOIS records;
  • - an error occurred in the WHOIS geolocation database.

Please confirm whether you are a US resident or not by clicking the relevant button below. If you choose the wrong option, being a US resident, you will not be able to open an account with InstaForex anyway.

We are sorry for any inconvenience caused by this message.