empty
22.09.2023 04:59 AM
Trading plan for EUR/USD on September 22. Simple tips for beginners

Analyzing Thursday's trades:

EUR/USD on 30M chart

This image is no longer relevant

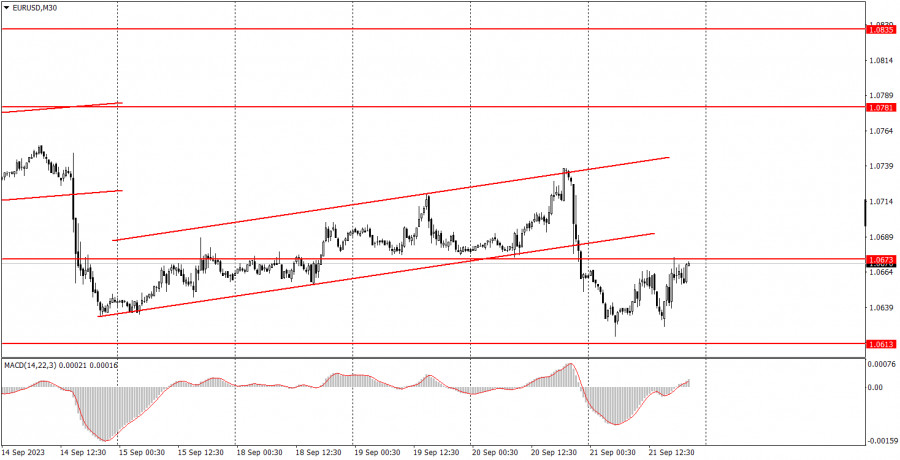
EUR/USD tried to correct higher on Thursday. History repeats itself. A week earlier, after the European Central Bank meeting on Thursday, the pair plummeted following a week of sluggish growth. This week, we saw the same pattern, but the crash occurred on Wednesday after the Federal Reserve (FOMC) meeting. Although the U.S. central bank did not announce any decision that was notably hawkish, the dollar continued to strengthen. And the market remembered that there was no reason to buy the dollar on Wednesday.

Then the Bank of England announced the results of its meeting, and the pound bulls were disappointed, who were already few in the market. However, the pound, which could have pulled the euro down with it, did not do so this time, and the euro even managed to slightly recover during the day. Therefore, from our perspective, the movements on Wednesday evening and throughout Thursday were quite chaotic, and it's better not to try to find logic in them. There could be dozens of explanations for such movements. The fact is that the fundamental backdrop was strong, and such a backdrop provokes "emotional storms" in the market.

EUR/USD on 5M chart

This image is no longer relevant

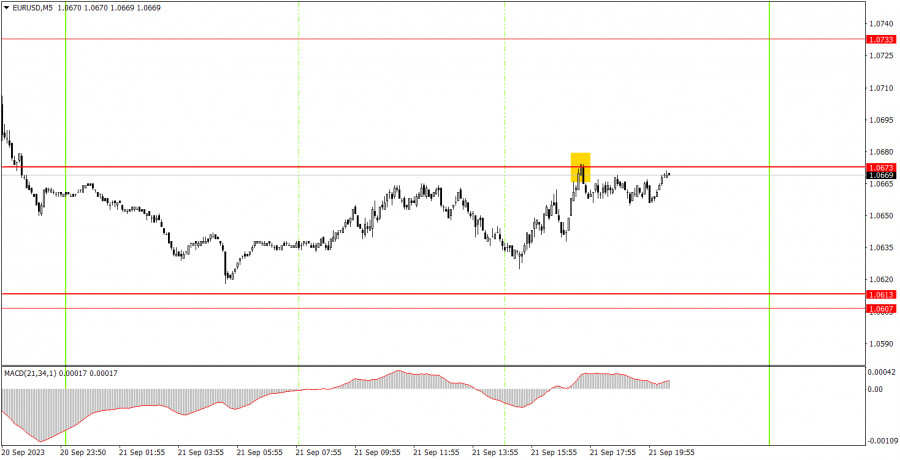
On the 5-minute chart, the pair showed volatility of 55 pips. In other words, the holiday came to an end, and once again we're facing harsh weekdays with volatility that was impossible to trade. For example, on Thursday, the pair moved by around 55 pips from the low to the high of the day. Luckily, only one trading signal was formed, and given the strength of the movement, there's an 80% chance that any signal would turn out to be false and the pair would be unable to reach its target level. By the middle of the US session, the pair reached the level of 1.0673, and then... nothing happened.

Trading tips on Friday:

On the 30-minute chart, EURUSD started a weak correction. The euro still lacks robust bullish indicators. In the medium term, we anticipate the euro's further decline, but the pair could still correct higher since they are also necessary. The key levels on the 5M chart are 1.0517-1.0533, 1.0607-1.0613, 1.0673, 1.0733, 1.0767-1.0781, 1.0835, 1.0871, 1.0901-1.0904. A stop loss can be set at a breakeven point as soon as the price moves 15 pips in the right direction. On Friday, traders now look to the release of the German, American, and EU Manufacturing and Services PMIs for September. All nine indices may show a decline, but we can't be certain. Everything will depend on the actual values and how they align with the forecasts.

Basic trading rules:

1) The strength of the signal depends on the time period during which the signal was formed (a rebound or a break). The shorter this period, the stronger the signal.

2) If two or more trades were opened at some level following false signals, i.e. those signals that did not lead the price to Take Profit level or the nearest target levels, then any consequent signals near this level should be ignored.

3) During the flat trend, any currency pair may form a lot of false signals or do not produce any signals at all. In any case, the flat trend is not the best condition for trading.

4) Trades are opened in the time period between the beginning of the European session and until the middle of the American one when all deals should be closed manually.

5) We can pay attention to the MACD signals in the 30M time frame only if there is good volatility and a definite trend confirmed by a trend line or a trend channel.

6) If two key levels are too close to each other (about 5-15 pips), then this is a support or resistance area.

How to read charts:

Support and Resistance price levels can serve as targets when buying or selling. You can place Take Profit levels near them.

Red lines are channels or trend lines that display the current trend and show which direction is better to trade.

MACD indicator (14,22,3) is a histogram and a signal line showing when it is better to enter the market when they cross. This indicator is better to be used in combination with trend channels or trend lines.

Important speeches and reports that are always reflected in the economic calendars can greatly influence the movement of a currency pair. Therefore, during such events, it is recommended to trade as carefully as possible or exit the market in order to avoid a sharp price reversal against the previous movement.

Beginners should remember that every trade cannot be profitable. The development of a reliable strategy and money management are the key to success in trading over a long period of time.

Paolo Greco,
ผู้เชี่ยวชาญด้านการวิเคราะห์ของ InstaForex
© 2007-2025
เลือกช่วงเวลา
5
นาที
15
นาที
30
นาที
1
ชั่วโมง
4
ชั่วโมง
1
วัน
1
สัปดาห์
รับผลกำไรจากการเปลี่ยนแปลงอัตราสกุลเงินดิจิทัลกับ InstaForex.
ดาวน์โหลด MetaTrader 4 และเปิดการซื้อขายครั้งแรกของคุณ.
  • Grand Choice
    Contest by
    InstaForex
    InstaForex always strives to help you
    fulfill your biggest dreams.
    เข้าร่วมการแข่งขัน


บทความแนะนำ

วิธีการเทรดคู่สกุลเงิน GBP/USD ในวันที่ 10 กรกฎาคม: เคล็ดลับง่ายๆ และการวิเคราะห์การเทรดสำหรับผู้เริ่มต้น

GBP/USD – กราฟ 1 ชั่วโมง ในวันพุธ คู่เงิน GBP/USD ยังติดอยู่ในกรอบที่เคลื่อนไหวแบบไร้ทิศทาง โดยมีความผันผวนต่ำมาก แทบไม่มีการเคลื่อนไหวของราคาระหว่างวัน ไม่มีเหตุการณ์ทางเศรษฐกิจมหภาค ขณะที่ Donald Trump

Paolo Greco 08:56 2025-07-10 UTC+2

วิธีการเทรดคู่สกุลเงิน EUR/USD ในวันที่ 10 กรกฎาคม: เคล็ดลับง่ายๆ และการวิเคราะห์การเทรดสำหรับผู้เริ่มต้น

EUR/USD – แผนภูมิ 1 ชั่วโมง ในวันพุธ คู่เงิน EUR/USD ยังคงซื้อขายตามแนวโน้มที่เกิดขึ้นมาแล้วในสัปดาห์ที่ผ่านมา กิจกรรมการตลาดในวันนั้นต่ำมาก และมีความผันผวนต่ำอย่างยิ่ง ตลาดได้แสดงปฏิกิริยาน้อยมากต่อการประกาศศุลกากรใหม่ที่ Donald Trump ประกาศในทองแดงและยารักษาโรค

Paolo Greco 08:48 2025-07-10 UTC+2

คำแนะนำการซื้อขายและการทบทวนการซื้อขายสำหรับ GBP/USD วันที่ 10 กรกฎาคม

เมื่อวันพุธที่ผ่านมา GBP/USD ยังคงอยู่ในช่องทางลง แต่เกิดรูปแบบที่น่าสนใจขึ้นในกรอบเวลา 4 ชั่วโมง ซึ่งราคาพยายามหลายครั้งที่จะทะลุผ่านเส้น Senkou Span B แต่ไม่สำเร็จ นี่แสดงว่าดัชนี Ichimoku ไม่ได้ส่งสัญญาณการกลับตัวของแนวโน้มลง แต่เป็นเพียงการปรับฐานซึ่งอาจสิ้นสุดเร็วที่สุดในวันนี้หรือพรุ่งนี้

Paolo Greco 06:57 2025-07-10 UTC+2

คำแนะนำการเทรดและการทบทวนการเทรดสำหรับ EUR/USD ประจำวันที่ 10 กรกฎาคม

ในวันพุธ คู่เงิน EUR/USD ยังคงเคลื่อนไหวภายในช่องขาลงอย่างอ่อนแอ ตามที่คาดไว้ก่อนหน้านี้ อย่างไรก็ตาม ความผันผวนลดลงถึงขีดสุด ไม่มีสถานการณ์เศรษฐกิจมหภาคมากระทบติดต่อกันเป็นวันที่สาม และตลาดเพิกเฉยต่อการประกาศเรื่องภาษีจำนวนมากจาก Donald Trump จุดแรกที่ต้องทำความกระจ่างในการวิเคราะห์นี้: ภาษีของ Trump ยังไม่ได้รับการบังคับใช้หรือยกขึ้น

Paolo Greco 06:45 2025-07-10 UTC+2

วิธีการเทรดคู่สกุลเงิน GBP/USD ในวันที่ 9 กรกฎาคม: เคล็ดลับง่ายๆ และการวิเคราะห์การเทรดสำหรับมือใหม่

ในวันอังคาร ค่าเงิน GBP/USD ยังคงลดลงอย่างค่อยเป็นค่อยไป ซึ่งถือเป็นการเคลื่อนไหวที่มีลักษณะทางเทคนิคและเป็นการแก้ไขเหตุการณ์ที่เกิดขึ้นทั้งเมื่อวันจันทร์และวันอังคารไม่มีเหตุการณ์ทางเศรษฐกิจมหภาคสำคัญๆ ในทั้งสหรัฐอเมริกาหรือสหราชอาณาจักร มีเพียงโดนัลด์ ทรัมป์ที่พยายาม "กระตุ้น" คู่ค้าด้วยการประกาศการเพิ่มอัตราศุลกากรสำหรับ 15 ประเทศอีกครั้ง ตลาดไม่ได้ตอบสนองต่อการตัดสินใจของประธานาธิบดีสหรัฐฯ นี้—ไม่เช่นนั้นเราคงได้เห็นการลดลงอย่างรวดเร็วของค่าเงินดอลลาร์อีกครั้ง ตลาดยังคงสงบเนื่องจากภาษีศุลกากรยังไม่ได้ถูกเพิ่ม

Paolo Greco 08:46 2025-07-09 UTC+2

วิธีการเทรดคู่สกุลเงิน EUR/USD ในวันที่ 9 กรกฎาคม? เคล็ดลับง่ายๆ และการวิเคราะห์การซื้อขายสำหรับมือใหม่

เมื่อวันอังคาร คู่สกุลเงิน EUR/USD ยังคงเคลื่อนไหวในทิศทางลงเล็กน้อยตามแนวโน้มที่เป็นอยู่ หลังจากที่มีการเคลื่อนไหวขึ้นอย่างแข็งแกร่ง ตลาดก็ได้เริ่มเข้าสู่การปรับฐาน ในลักษณะของการปรับฐานในปัจจุบันสอดคล้องกับลักษณะของการปรับฐานทางเทคนิคอย่างเต็มที่ ภายใต้สภาวะเช่นนี้ เราคาดว่าจะมีการเสริมความแข็งแกร่งทางเทคนิคของดอลลาร์สหรัฐในระดับปานกลาง หลังจากนั้นแนวโน้มขาขึ้นน่าจะกลับมาอีกครั้ง ในขณะนี้ เส้นแนวโน้มขาลงก่อตัวขึ้น ซึ่งสามารถช่วยให้ผู้ค้าเริ่มต้นระบุสิ้นสุดของการปรับฐานได้ นอกจากนี้ยังควรตั้งข้อสังเกตว่าดอลลาร์มีเหตุผลที่สมเหตุสมผลในการขึ้นค่าเมื่อสัปดาห์ที่แล้ว แต่ตลาดกลับเพิกเฉย

Paolo Greco 08:28 2025-07-09 UTC+2

คำแนะนำการซื้อขายและการทบทวนการซื้อขายสำหรับ GBP/USD ในวันที่ 9 กรกฎาคม

คู่เงิน GBP/USD ได้ขยายการลดลงจากสัปดาห์ที่แล้วตลอดวันอังคารที่ผ่านมา เป็นการเตือนความจำว่า ดอลลาร์สหรัฐฯ ได้รับปัจจัยสนับสนุนที่อาจทำให้แข็งค่าขึ้นเมื่อสัปดาห์ที่แล้ว แต่กลับแข็งค่าเพียงวันเดียว และไม่ได้เป็นผลจากข้อมูลเศรษฐกิจมหภาคที่แข็งแกร่งจากสหรัฐฯ สัปดาห์นี้ ไม่มีการตีพิมพ์ข้อมูลเศรษฐกิจมหภาคใด ๆทั้งในสหราชอาณาจักรหรือสหรัฐฯ ในขณะที่พื้นฐานโดยรวมยังคงทำให้ดอลลาร์อ่อนค่า เมื่อวานมีรายงานว่า Donald Trump

Paolo Greco 07:35 2025-07-09 UTC+2

คำแนะนำการซื้อขายและการวิเคราะห์การซื้อขายสำหรับคู่เงิน EUR/USD ประจำวันที่ 9 กรกฎาคม

คู่เงิน EUR/USD ยังคงลดลงในวันอังคาร ถึงแม้จะไม่มีเหตุผลพื้นฐานใด ๆ ที่อธิบายการเติบโตของดอลลาร์ รายงานกล่าวว่า Donald Trump ตัดสินใจปรับขึ้นภาษี ไม่เพียงแต่กับญี่ปุ่นและเกาหลีใต้ แต่ยังรวมถึงประเทศอื่น ๆ อีกหลายแห่ง แม้ว่าประเทศเหล่านี้จะไม่ใช่เศรษฐกิจหลักและตลาดเพิ่งจะตอบสนองต่อภาษีกับประเทศอย่างเซอร์เบียหรือตูนิเซีย

Paolo Greco 07:09 2025-07-09 UTC+2

วิธีการเทรดคู่สกุลเงิน GBP/USD ในวันที่ 8 กรกฎาคม? เคล็ดลับง่ายๆ และการวิเคราะห์การเทรดสำหรับมือใหม่

กราฟ GBP/USD ระยะเวลา 1 ชั่วโมง ในวันจันทร์ คู่สกุลเงิน GBP/USD มีการเคลื่อนไหวแบบไร้ทิศทางอย่างชัดเจน บนกรอบเวลาหนึ่งชั่วโมง ราคาปิดต่ำกว่าขั้นแนวโน้มขาขึ้น แต่ตามความเห็นของเรา นี่ไม่ได้เปิดโอกาสใหม่ๆ ให้กับดอลลาร์สหรัฐฯ หากดอลลาร์จะมีความแข็งแกร่งขึ้น

Paolo Greco 10:45 2025-07-08 UTC+2

วิธีการซื้อขายคู่สกุลเงิน EUR/USD ในวันที่ 8 กรกฎาคม: เคล็ดลับง่ายๆ และการตรวจสอบการซื้อขายสำหรับผู้เริ่มต้น

รีวิวการซื้อขายวันจันทร์: EUR/USD, กราฟ 1H ในวันจันทร์ คู่เงิน EUR/USD ได้มีแนวโน้มการซื้อขายที่ลดลง และค่าเงินดอลลาร์สหรัฐมีการเพิ่มขึ้นที่ค่อนข้างแข็งแกร่ง อย่างที่เราได้กล่าวไว้ก่อนหน้านี้ แม้ว่าภายใต้การนำของ Donald Trump ค่าเงินดอลลาร์ก็ไม่ได้ลดลงทุกวัน—คาดว่าจะมีการปรับฐานเป็นครั้งคราว อย่างไรก็ตามการเพิ่มขึ้นอย่างรวดเร็วของค่าเงินดอลลาร์มักจะถูกมองด้วยความสงสัยและระมัดระวัง

Paolo Greco 10:09 2025-07-08 UTC+2
หากไม่สะดวกคุยในตอนนี้
ระบุคำถามไว้ได้ใน แชท.
Widget callback
 

Dear visitor,

Your IP address shows that you are currently located in the USA. If you are a resident of the United States, you are prohibited from using the services of InstaFintech Group including online trading, online transfers, deposit/withdrawal of funds, etc.

If you think you are seeing this message by mistake and your location is not the US, kindly proceed to the website. Otherwise, you must leave the website in order to comply with government restrictions.

Why does your IP address show your location as the USA?

  • - you are using a VPN provided by a hosting company based in the United States;
  • - your IP does not have proper WHOIS records;
  • - an error occurred in the WHOIS geolocation database.

Please confirm whether you are a US resident or not by clicking the relevant button below. If you choose the wrong option, being a US resident, you will not be able to open an account with InstaForex anyway.

We are sorry for any inconvenience caused by this message.