empty
16.10.2023 11:40 AM
Weekly forecast based on simplified wave analysis for GBP/USD, AUD/USD, USD/CHF, EUR/JPY, and US Dollar Index on October 16th

GBP/USD

Brief Analysis:

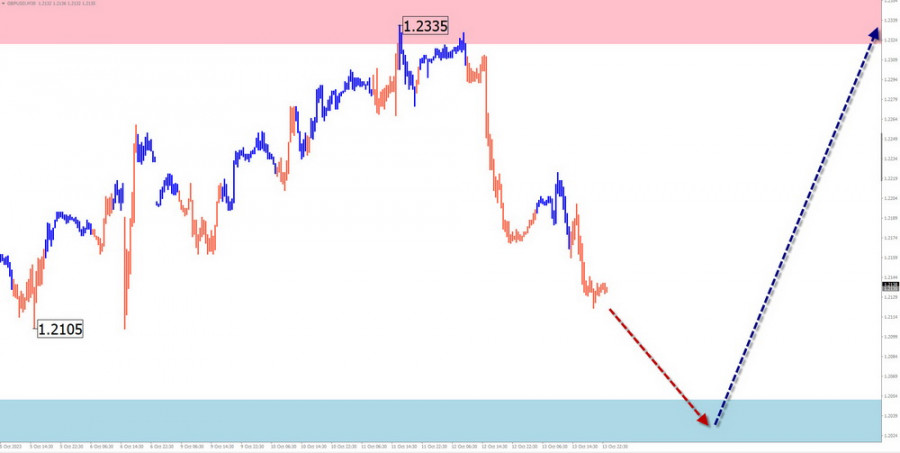
The current wave structure of the British pound chart, at the time of analysis, counts from mid-July. Its wave level has reached the upper boundary of a strong potential daily reversal zone. Over the last two weeks, quotes have formed a zigzag pattern in the form of a stretched horizontal plane. The corrective structure is unfinished at the time of analysis.

Weekly Forecast:

In the upcoming week, the price of the pair is expected to move within a range between the nearest opposing zones. A bearish vector is more likely at the beginning of the week. A price decline can be expected due to the calculated support. By the end of the week, there is an increased likelihood of a change in direction.

This image is no longer relevant

Potential Reversal Zones

Resistance:

  • 1.2320/1.2370

Support:

  • 1.2050/1.2000

Recommendations:

Purchases: The resistance zone has a limit. After the appearance of reversal signals in the resistance zone, purchases with a reduced volume within the intraday framework will become possible.

Sales: Possible within separate sessions with reduced volume.

AUD/USD

Brief Analysis:

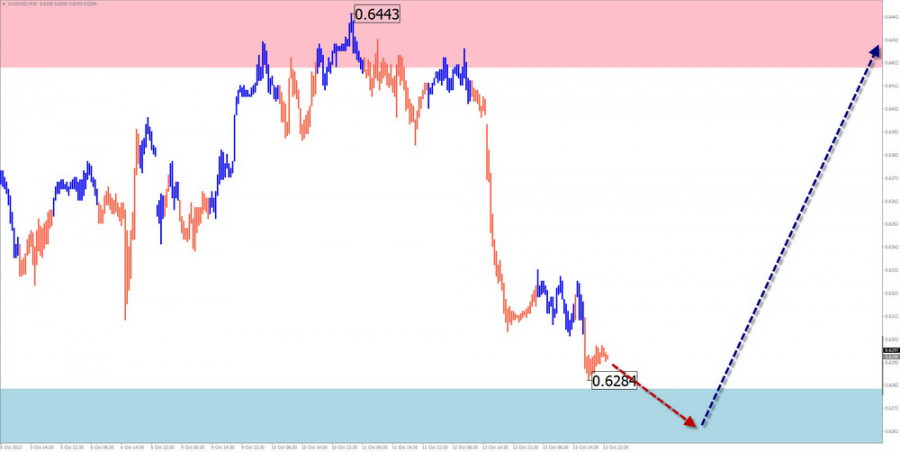
The Australian dollar market continues its southward movement on the price chart. The unfinished segment counts from mid-July. Within this segment, in the last decade, the price has formed a flat correction that is unfinished at the time of analysis. Quotes are near the lower boundary of strong resistance.

Weekly Forecast:

In the next couple of days, a sideways range is expected, in which conditions for a change in direction will be formed. The beginning of a decline is likely closer to the end of the week. It is unlikely that the price will move below the calculated support within the next week.

This image is no longer relevant

Potential Reversal Zones

Resistance:

  • 0.6420/0.6470

Support:

  • 0.6280/0.6230

Recommendations:

Purchases: will become relevant after the appearance of confirmed reversal signals in the resistance zone.

Sales: high-risk and not recommended.

USD/CHF

Brief Analysis:

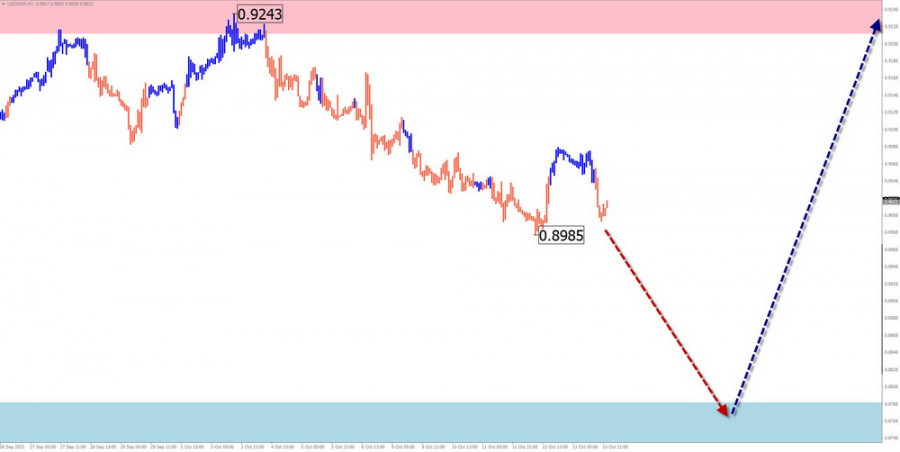
The current wave structure of the Swiss franc major chart is directed upward. It started on July 14th. On the larger daily chart, this segment became a correction. The price has reached the lower boundary of a strong resistance zone. In the past two weeks, the pair's quotes have been retracing downward from this level, forming a corrective flat.

Weekly Forecast:

At the beginning of the upcoming week, there is a high probability of continued decline, possibly down to the support zone. A brief breakthrough of its lower boundary is possible. Closer to the weekend, the likelihood of a reversal and a resumption of price growth increases.

This image is no longer relevant

Potential Reversal Zones

Resistance:

  • 0.9220/0.9270

Support:

  • 0.8790/0.8740

Recommendations

Sales: Can be used for short-term trading with a reduced lot size.

Purchases: will become possible after the appearance of reversal signals in the support area, according to your trading system (TS).

EUR/JPY

Brief Analysis:

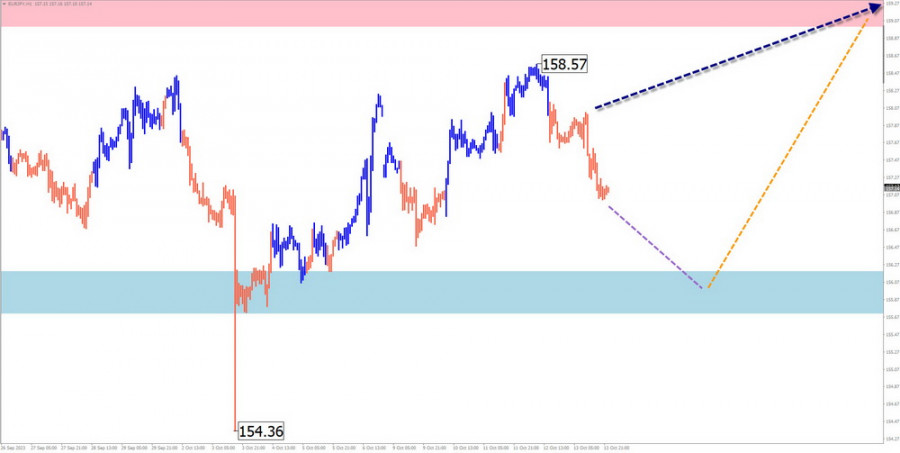
An ascending wave pattern has been controlling the price movement of the euro against the Japanese yen since late July of this year. In its structure, the middle part (B) has been forming for the last three months. During this time, the price has moved in a sideways pattern, forming a price corridor of approximately 3 price figures.

Weekly Forecast:

At the beginning of the upcoming week, the price of the pair is expected to experience a flat decline down to the calculated support level. Afterwards, you can expect a reversal and a resumption of price growth. The resistance zone shows the most likely upper boundary of the pair's weekly movement.

This image is no longer relevant

Potential Reversal Zones

Resistance:

  • 159.00/159.50

Support:

  • 156.20/155.70

Recommendations

Sales: Possible with a reduced lot size within a separate session. The support zone limits the potential for a decline.

Purchases: will become relevant after the appearance of confirmed reversal signals in the support area.

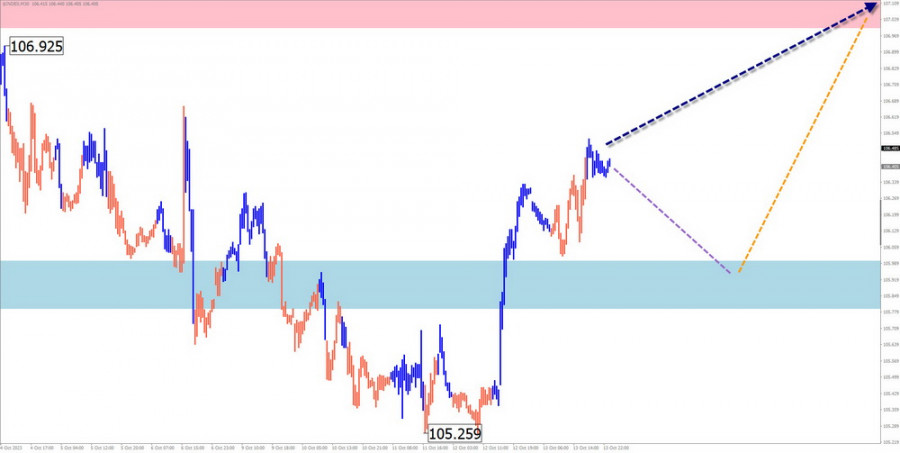
US Dollar Index

Brief Analysis:

As a result of a three-month bullish trend, the dollar quotes are approaching the lower boundary of a powerful potential reversal zone. The unfinished segment of the main course started on October 4th. In its structure, the middle part of the wave (B) is forming in the form of a stretched flat.

Weekly Forecast:

Throughout the upcoming week, the dollar is expected to move within a price range between opposing zones. At the beginning of the week, a downward vector is more likely. A change in direction can be expected closer to the weekend. A breakthrough in the calculated zones within the week is unlikely.

This image is no longer relevant

Potential Reversal Zones

Resistance:

  • 107.00/107.20

Support:

  • 106.00/105.80

Recommendations

Purchases: Short-term deals for strengthening positions in national currencies in major pairs may be possible.

Sales: This will be recommended for national currencies after the strengthening begins in the support zone of the US dollar quotes.

Note: In simplified wave analysis (SWA), all waves consist of three parts (A, B, and C). The analysis focuses on the last unfinished wave in each time frame. Dotted lines indicate expected movements.

Attention: The wave algorithm does not consider the duration of instrument movements in time.

เลือกช่วงเวลา
5
นาที
15
นาที
30
นาที
1
ชั่วโมง
4
ชั่วโมง
1
วัน
1
สัปดาห์
รับผลกำไรจากการเปลี่ยนแปลงอัตราสกุลเงินดิจิทัลกับ InstaForex.
ดาวน์โหลด MetaTrader 4 และเปิดการซื้อขายครั้งแรกของคุณ.
  • Grand Choice
    Contest by
    InstaForex
    InstaForex always strives to help you
    fulfill your biggest dreams.
    เข้าร่วมการแข่งขัน


บทความแนะนำ

การวิเคราะห์ GBP/USD วันที่ 2 กรกฎาคม 2025

รูปแบบคลื่นสำหรับคู่เงิน GBP/USD ยังคงบ่งชี้ถึงการก่อตัวของลำดับคลื่นที่เพิ่มขึ้น ในทำนองเดียวกันกับคู่เงิน EUR/USD เนื่องจากเงินดอลลาร์สหรัฐยังคงเป็นปัจจัยสำคัญที่ทำให้เกิดการเปลี่ยนแปลง ความต้องการเงินดอลลาร์ลดลงทั่วทั้งตลาด ทำให้เกิดไดนามิกคล้ายกันในเครื่องมือหลายอย่าง คลื่น 2 ของส่วนแนวโน้มขาขึ้นเกิดในรูปแบบคลื่นเดี่ยว ภายในคลื่น 3 ที่คาดการณ์ไว้ คลื่น

Chin Zhao 20:33 2025-07-02 UTC+2

การวิเคราะห์ EUR/USD ประจำวันที่ 2 กรกฎาคม 2025

รูปแบบคลื่นในกราฟ 4 ชั่วโมงสำหรับ EUR/USD ยังคงบ่งบอกถึงการก่อตัวของช่วงแนวโน้มขาขึ้น สงครามการค้าที่ Donald Trump เริ่มต้นขึ้นมีวัตถุประสงค์เพื่อเพิ่มรายได้งบประมาณและลดการขาดดุลการค้า อย่างไรก็ตาม เป้าหมายเหล่านี้ยังไม่บรรลุข้อตกลง โดยข้อตกลงทางการค้ากำลังถูกลงนามด้วยความยากลำบาก และ "One

Chin Zhao 20:31 2025-07-02 UTC+2

การวิเคราะห์ GBP/USD ประจำวันที่ 30 มิถุนายน 2025

รูปแบบคลื่นสำหรับ GBP/USD ยังคงชี้ให้เห็นถึงการสร้างรูปแบบคลื่นขับเคลื่อนขาขึ้น รูปแบบคลื่นมีลักษณะเกือบจะเหมือนกับ EUR/USD เนื่องจากดอลลาร์สหรัฐยังคงเป็นปัจจัยขับเคลื่อนหลักของการเคลื่อนไหวในตลาด ความต้องการดอลลาร์ลดลงทั่วทั้งกระดาน ส่งผลให้มีพลวัตคล้ายกันในเครื่องมือหลายๆ ตัว คลื่น 2 ของแนวโน้มขาขึ้นได้กลายเป็นคลื่นเดียว ภายในคลื่น 3 ที่สมมติว่าเป็นคลื่น

Chin Zhao 20:00 2025-06-30 UTC+2

การวิเคราะห์ EUR/USD ประจำวันที่ 30 มิถุนายน 2025

รูปแบบคลื่นในกราฟ 4 ชั่วโมงของ EUR/USD ยังคงบ่งบอกการเกิดขึ้นของช่วงแนวโน้มขาขึ้น จนถึงวันที่ 28 กุมภาพันธ์ เมื่อดอลลาร์สหรัฐเริ่มลดลง ทั้งรูปแบบคลื่นดูเหมือนแนวโน้มขาลงอย่างใหญ่หลวง มันกำลังสร้างคลื่นปรับฐาน 2 อย่างไรก็ตาม สงครามการค้าที่เริ่มขึ้นโดย Donald

Chin Zhao 19:47 2025-06-30 UTC+2

การคาดการณ์รายสัปดาห์อิงตามการวิเคราะห์คลื่นอย่างง่ายสำหรับ GBP/USD, AUD/USD, USD/CHF, EUR/JPY, EUR/CHF และดัชนีดอลลาร์สหรัฐ ณ วันที่ 30 มิถุนายน

GBP/USD การวิเคราะห์: โครงสร้างของคลื่นขาขึ้นใน GBP/USD ซึ่งเริ่มต้นตั้งแต่ต้นปีนี้ ยังไม่มีสัญญาณบ่งบอกว่าเสร็จสมบูรณ์แล้ว ราคาได้เข้าสู่ขอบล่างของเขตกลับตัวที่สำคัญ หลังจากการถอยหลัง คู่เงินยังคงสร้างคลื่นขาขึ้นตั้งแต่วันที่ 18 มิถุนายน โดยระดับคลื่นได้เกินการถอยไปแล้ว การคาดการณ์: คาดว่าราคาเคลื่อนไหวในแนวด้านข้างในช่วงวันที่ต้องการซื้อขายนี้ โดยมีความเป็นไปได้ที่จะกลับเข้าสู่เขตต้านทานได้อีกครั้ง

Isabel Clark 11:27 2025-06-30 UTC+2

การพยากรณ์รายสัปดาห์ตามการวิเคราะห์คลื่นแบบง่ายสำหรับ EUR/USD, USD/JPY, GBP/JPY, USD/CAD, NZD/USD และ GOLD ณ วันที่ 30 มิถุนายน

EUR/USD วิเคราะห์: ตั้งแต่เดือนกุมภาพันธ์ปีนี้ การเคลื่อนไหวของราคายูโรได้เป็นไปตามอัลกอริธึมขึ้นคลื่น ตั้งแต่กลางเดือนเมษายนได้เกิดการปรับฐานแอบแฝงภายในโครงสร้าง แนวโน้มเส้นที่ลากผ่านจุดสูงต่ำสุดนั้นได้ก่อให้เกิดรูปแบบ "horizontal pennant" ซึ่งยังไม่เสร็จสมบูรณ์ ขณะนี้ราคามาถึงขอบเขตล่างของโซนกลับตัวที่มีความแข็งแกร่ง คาดการณ์: ในอีกไม่กี่วันข้างหน้า การเคลื่อนที่แบบด้านข้างต่อเนื่องคาดว่าจะเกิดขึ้น บริเวณใกล้โซนต้านทานมีแนวโน้มว่าจะเกิดการกลับตัวเริ่มต้น คาดว่าวันสิ้นสัปดาห์จะเริ่มมีทิศทางลงใหม่

Isabel Clark 10:57 2025-06-30 UTC+2

การวิเคราะห์ GBP/USD ประจำวันที่ 26 มิถุนายน 2025

รูปแบบคลื่นสำหรับ GBP/USD ยังคงบ่งชี้ถึงการพัฒนาของโครงสร้างคลื่นกระตุ้นตลาดในแนวโน้มขาขึ้น รูปแบบคลื่นนี้เกือบจะเหมือนกับของ EUR/USD เนื่องจากปัจจัยสำคัญของการพุ่งขึ้นอยู่ที่สกุลเงินดอลลาร์สหรัฐ ความต้องการสำหรับดอลลาร์กำลังลดลงในตลาดทั้งหมด ทำให้เกิดไดนามิกแบบเดียวกันทั่วทั้งเครื่องมือหลายชนิด คลื่นที่ 2 ของแนวโน้มขาขึ้นได้เปลี่ยนเป็นรูปแบบการปรับฐานคลื่นเดียว ภายในคลื่นที่ 3 ที่คาดการณ์ไว้ มีคลื่นย่อย

Chin Zhao 19:27 2025-06-26 UTC+2

การวิเคราะห์ EUR/USD วันที่ 26 มิถุนายน 2025

รูปแบบคลื่นบนกราฟ 4 ชั่วโมงสำหรับ EUR/USD ยังคงบ่งชี้ถึงการก่อตัวของช่วงแนวโน้มขาขึ้น จนถึงวันที่ 28 กุมภาพันธ์ เมื่อการลดลงของค่าเงินดอลลาร์สหรัฐเริ่มขึ้น โครงสร้างคลื่นทั้งหมดดูเหมือนจะเป็นแนวโน้มขาลงที่น่าเชื่อถือ โดยสร้างคลื่นแก้ไขที่ 2 อย่างไรก็ตาม สงครามทางการค้าที่ Donald

Chin Zhao 19:20 2025-06-26 UTC+2

การวิเคราะห์ EUR/USD วันที่ 25 มิถุนายน 2025

รูปแบบคลื่นในกราฟ 4 ชั่วโมงของ EUR/USD ยังคงบ่งชี้ถึงการก่อตัวของช่วงแนวโน้มขาขึ้น จนถึงวันที่ 28 กุมภาพันธ์ เมื่อค่าเงินดอลลาร์สหรัฐเริ่มอ่อนค่าลง ทั้งรูปแบบคลื่นทั้งหมดดูเหมือนจะเป็นแนวโน้มขาลงที่น่าเชื่อถือ โดยมีคลื่นปรับฐานที่ 2 กำลังหล่อรูป อย่างไรก็ตาม สงครามการค้าที่

Chin Zhao 19:10 2025-06-25 UTC+2

การวิเคราะห์คู่เงิน GBP/USD ประจำวันที่ 24 มิถุนายน 2025

รูปแบบคลื่นสำหรับ GBP/USD ยังคงบ่งชี้ถึงการก่อตัวของชุดคลื่นขาขึ้นแบบเร่งด่วน รูปแบบคลื่นนี้เกือบจะเหมือนกับ EUR/USD เพราะปัจจัยหลักในทั้งสองกรณีนี้ยังคงเป็นดอลลาร์สหรัฐฯ ความต้องการดอลลาร์ลดลงทั่วกระดาน ซึ่งเป็นเหตุผลที่ทำให้เครื่องมือทางการเงินหลายชิ้นมีพลวัตคล้ายกัน คลื่นที่ 2 ของแนวโน้มขาขึ้นได้กลายเป็นรูปแบบคลื่นเดียว ภายในคลื่นที่ 3 ที่คาดการณ์ไว้ คลื่นที่

Chin Zhao 19:35 2025-06-24 UTC+2
หากไม่สะดวกคุยในตอนนี้
ระบุคำถามไว้ได้ใน แชท.
Widget callback
 

Dear visitor,

Your IP address shows that you are currently located in the USA. If you are a resident of the United States, you are prohibited from using the services of InstaFintech Group including online trading, online transfers, deposit/withdrawal of funds, etc.

If you think you are seeing this message by mistake and your location is not the US, kindly proceed to the website. Otherwise, you must leave the website in order to comply with government restrictions.

Why does your IP address show your location as the USA?

  • - you are using a VPN provided by a hosting company based in the United States;
  • - your IP does not have proper WHOIS records;
  • - an error occurred in the WHOIS geolocation database.

Please confirm whether you are a US resident or not by clicking the relevant button below. If you choose the wrong option, being a US resident, you will not be able to open an account with InstaForex anyway.

We are sorry for any inconvenience caused by this message.